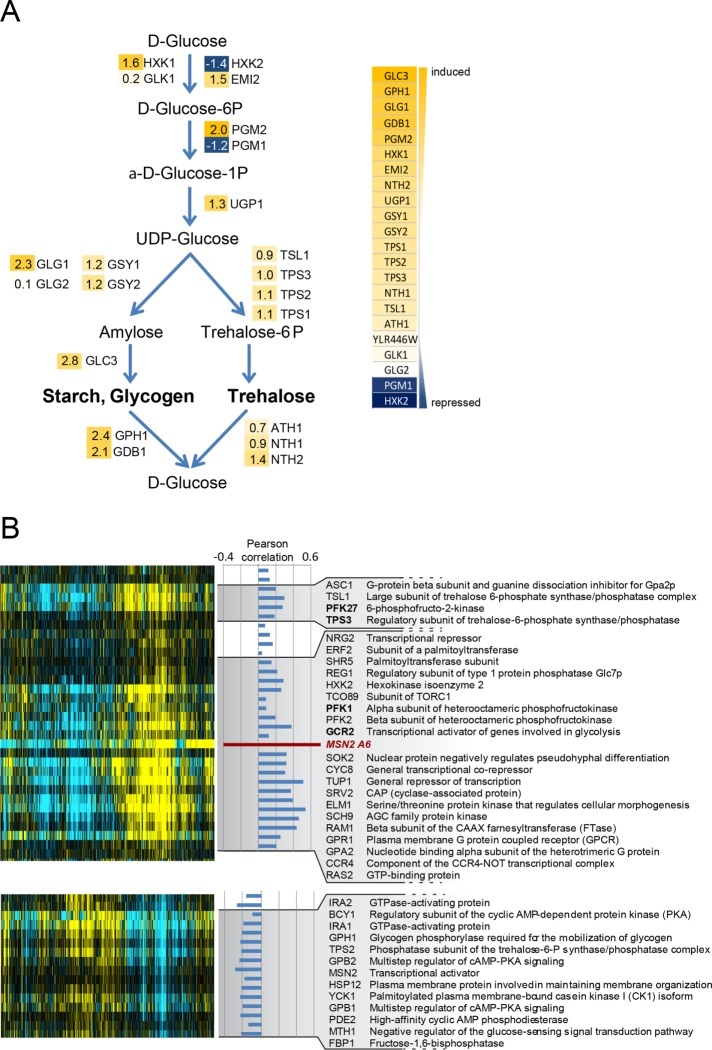
Figure 3:
The Msn2A6 expression profile resembles that of glucose-starved cells. (A) Expression changes of glycogen and trehalose synthesis genes (log2 values indicated). (B) Microarray analysis of W303 msn2∆msn4∆ cells expressing Msn2A6 under control of the GAL1-10 promoter driven by the 17-ß-estradiol–inducible ADGEV transcription factor. The normalized Msn2A6 expression profile was aligned by hierarchical clustering to a compendium of microarrays derived from mutants involved in glucose metabolism and signaling. Pearson´s correlation coefficient (PC) values are indicated between the Msn2A6 expression profile and the respective genes; the most significant correlated and anti-correlated genes are selected. The full description and data represented in the figure are provided as supplemental files (Supplemental Figure S4; Supplemental Data File S2).

