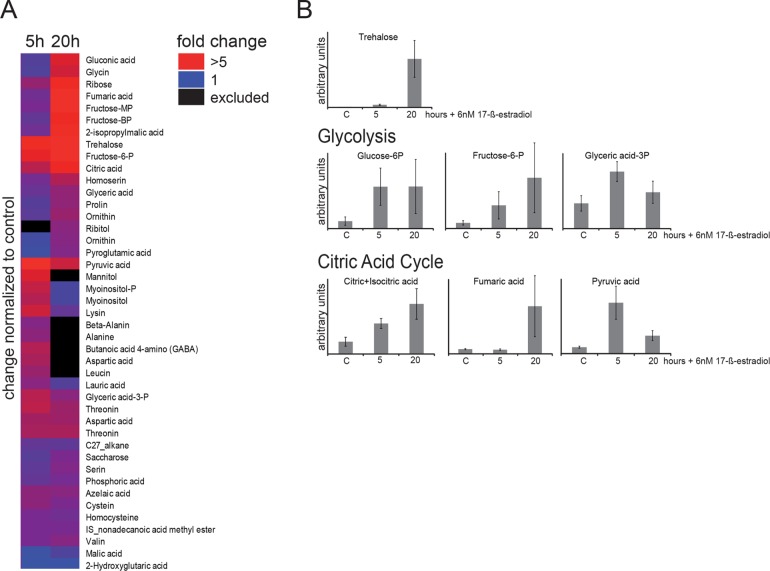
Figure 6:
Metabolite concentrations are affected by Msn2A6 expression. W303 wild-type cells carrying plasmids pGAL1-10-MSN2A6 and pADGEV were grown in liquid synthetic media. Msn2A6 expression was induced by treatment with 6 nM 17-ß-estradiol for 5 and 20 h and levels of hallmark metabolites of glycolysis and the citric acid cycle were captured by LC-MS. Control cells were grown without 17-ß-estradiol and harvested at the same optical density. (A) Metabolite changes due to expression of Msn2A6. Data are expressed as fold change to untreated controls and sorted by hierarchical clustering. (B) Peak intensity is expressed as arbitrary units.

