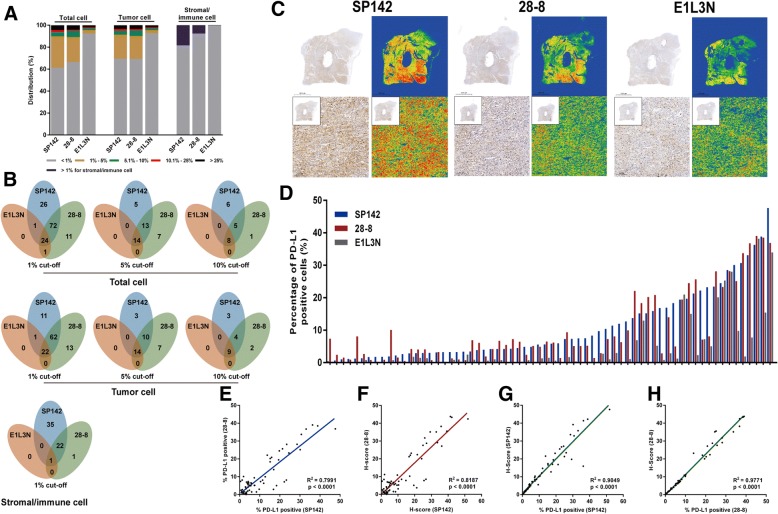
Fig. 2.
Qualitative and quantitative analysis of PD-L1 staining in total cells, tumor cells and immune/stromal cells. a A detailed description of the distribution of PD-L1 expression in total cells, tumor cells and immune/stromal cells stained with clones SP142, 28–8 and E1L3N is shown. b A detailed description of the PD-L1 expression at the 1, 5 and 10% cut-off value in total cells and tumor cells, and the 1% cut-off value in immune/stromal cells stained with clones SP142, 28–8 and E1L3N is shown. c Images of IHC staining with the three PD-L1 antibody clones and heatmaps analyzing a representative sample showing varying staining intensities and densities for the three clones. d A detailed description of the distribution of the PD-L1 expression across three antibody clones for 66 specimens by computer-automated quantitative analysis. Representative plot showing the positive percentage (e) and “H-score” (f) of total cells positivity for PD-L1 staining using clones SP142 and 28–8 in 66 samples. A strong correlation was observed between clones SP142 and 28–8 (R2 = 0.7991 for positive percentage and R2 = 0.8187 for “H-score”). g, h Strong correlations were observed between the percentage of positively stained cells and the “H-score” for clones SP142 (R2 = 0.9049) and 28–8 (R2 = 0.9771) in 66 samples, particularly clone 28–8. Each dot represents a single specimen. PD-L1, programmed death ligand 1; IHC, immunohistochemistry

