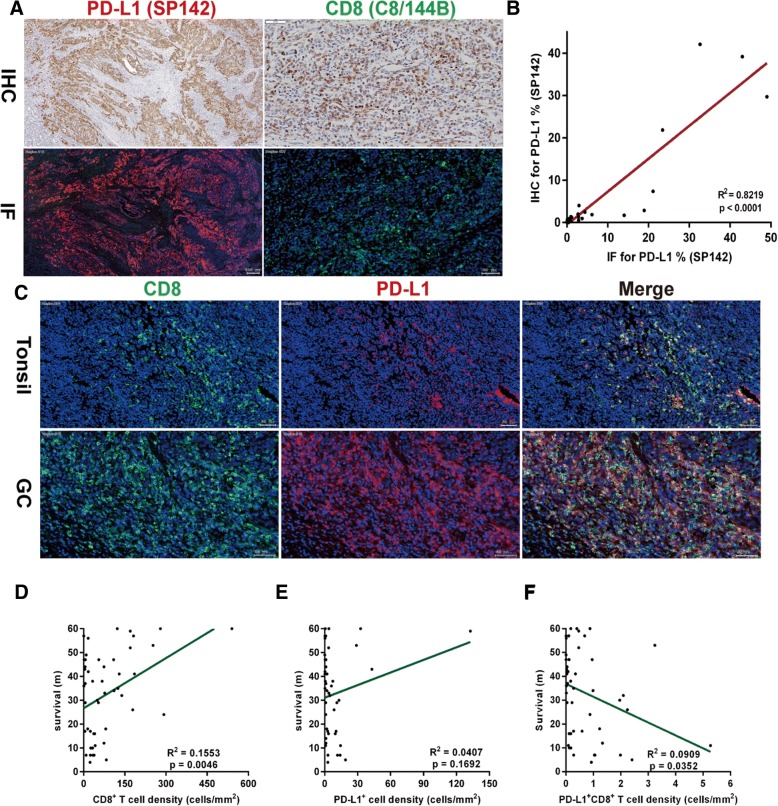
Fig. 5.
Quantitative analysis of the correlation between density of PD-L1+CD8+ T cells and survival. a Immunofluorescence (IF) for PD-L1 clone SP142 and CD8 clone C8/144B showed an extremely similar staining pattern as IHC, with a strong correlation (R2 = 0.8219) for PD-L1 (b). Each dot represents a single specimen. Normal tonsil tissue was used as a positive control. c Representative images of IF staining in tonsil tissue and GC are shown, in which CD8 was recognized in the Cy5 channel (green) and PD-L1 was recognized in the Texas Red channel (red) and displayed membrane expression. d A positive correlation was shown between the density of CD8+ T cells and survival time. e No relationship was observed between the density of PD-L1+ cells and survival. f A negative correlation was shown between the density of PD-L1+CD8+ T cells and survival time. PD-L1, programmed death ligand 1; IF, immunofluorescence; GC, gastric cancer

