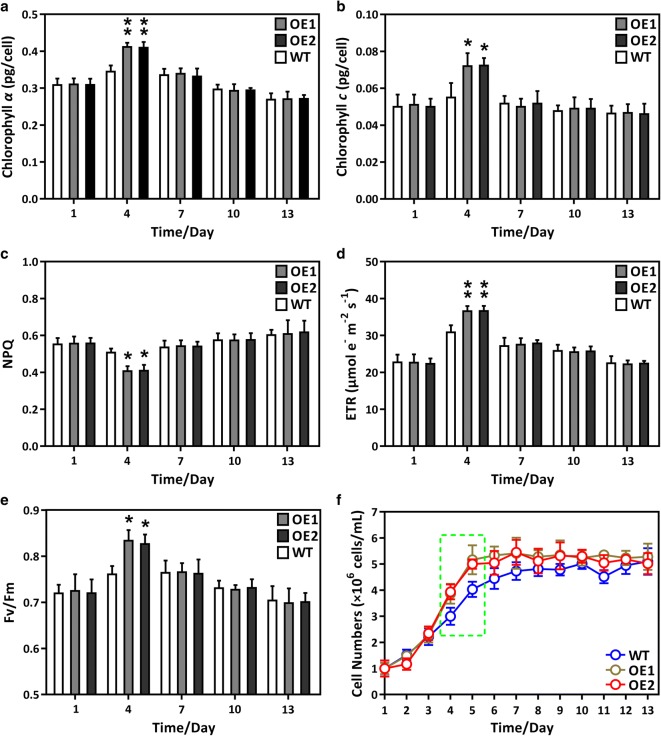
Fig. 2.
Physiological characterization of GPAT1 and LPAT1 dual overexpression lines (OE1 and OE2) and wild-type (WT) during the whole growth period (13 days). a Chlorophyll α content; b chlorophyll c content; c non-photochemical quenching (NPQ); d electron transport rate (ETR); e effective photochemical efficiency of photosystem II (Fv/Fm); f growth curve. A significant difference between WT and OE lines is indicated at the p < 0.05 (*) or p < 0.01 (**) level. Each value represents the mean ± SD (n = 3)

