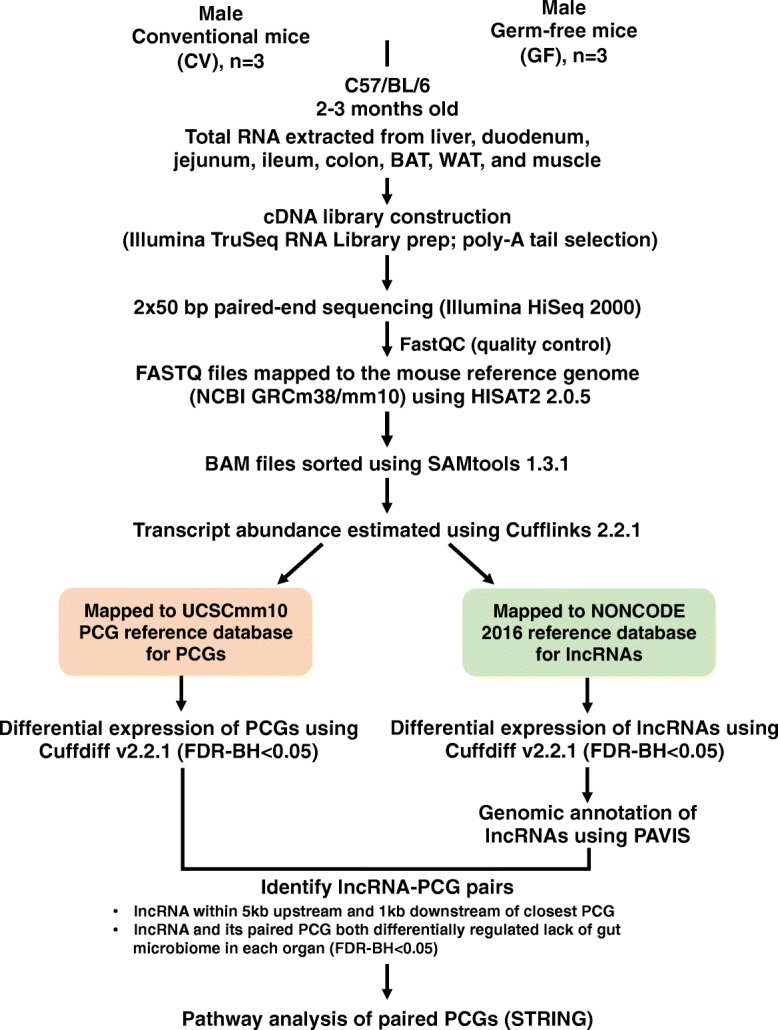
Fig. 14.

Diagram illustrating the experimental design and workflow for RNA-seq data analysis. Briefly, tissues from 2 to 3-month-old C57BL/6 conventional (CV) and germ-free (GF) mice were harvested as described previously [29]. Total RNAs were extracted from each organ (n = 3 per enterotype per organ). The cDNA libraries were prepared using the poly-A tail selection method and were sequenced using an Illumina HiSeq2000 sequencer (2 × 50 bp paired-end). Fastq files were quality-checked with FastQC and mapped to the mouse reference genome (mm10) using HISAT. The sequence alignment mapping (SAM) files were converted to binary alignment mapping (BAM) files and sorted using SAMtools. The sorted BAM files were subjected to Cufflinks to determine the transcript abundance. Specifically, the transcript abundance of lncRNAs and PCGs was estimated using the mouse NONCODE 2016 lncRNA and UCSC mm10 PCG reference gene transfer format (GTF) files, respectively. The differentially expressed lncRNAs and PCGs were determined by Cuffdiff between CV and GF mice for each organ (FDR-BH < 0.05). The genomic annotation of differentially expressed lncRNAs and their closest PCGs were annotated using PAVIS. A lncRNA is considered paired with a proximal PCG if 1) the lncRNA overlaps with the coding region or is within 5 kb upstream of TSS or 1 kb downstream of TTS of any PCG and 2) both the lncRNA and the proximal PCG were differentially expressed between CV and GF mice (average FPKM > 1 in either CV or GF mice and FDR-BH < 0.05). The PCGs paired with lncRNAs were subjected to pathway analysis using STRING
