Fig. 1.

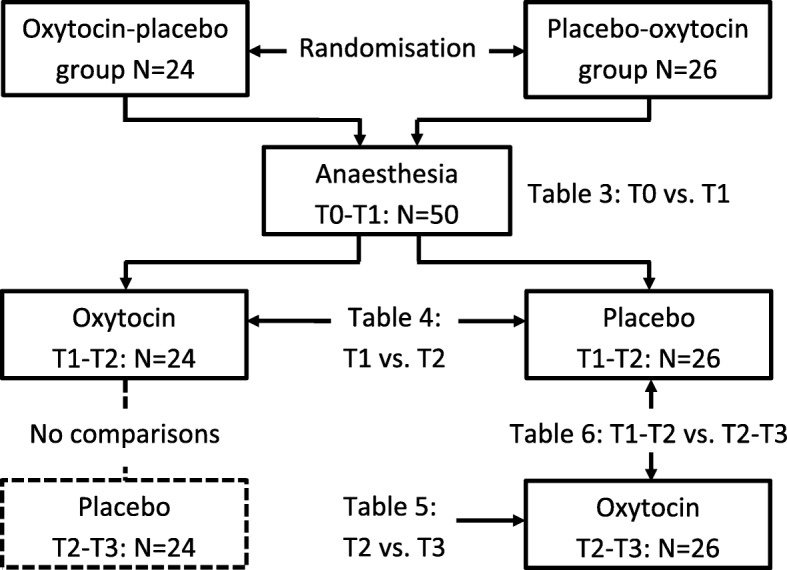
Flow chart showing the steps of the experiment. The first drugs were administered between the T1 and T2 measurement points, and the second drugs between T2 and T3

Flow chart showing the steps of the experiment. The first drugs were administered between the T1 and T2 measurement points, and the second drugs between T2 and T3