
Fig. 1.
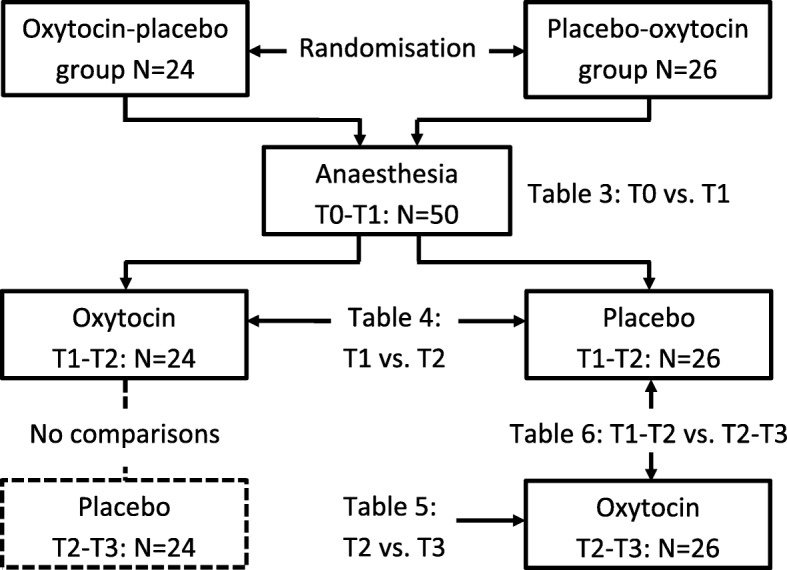
Flow chart showing the steps of the experiment. The first drugs were administered between the T1 and T2 measurement points, and the second drugs between T2 and T3
Official websites use .gov
A
.gov website belongs to an official
government organization in the United States.
Secure .gov websites use HTTPS
A lock (
) or https:// means you've safely
connected to the .gov website. Share sensitive
information only on official, secure websites.
Flow chart showing the steps of the experiment. The first drugs were administered between the T1 and T2 measurement points, and the second drugs between T2 and T3