Fig. 1.
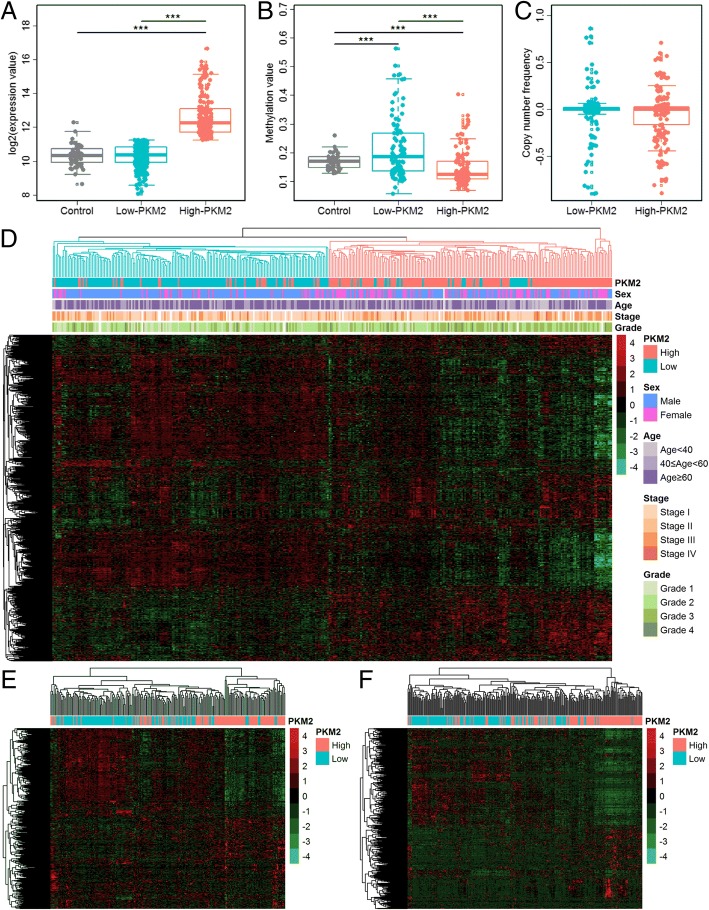
PKM2 and metabolic gene expression profiles. a The expression levels of PKM2 in low-PKM2 (< 11.25) patients (light blue) were similar to the controls (gray), whereas the expression levels of PKM2 in high-PKM2 (≥ 11.25) patients (red) were significantly higher than the controls. b Methylation value of PKM2 in low-PKM2 patients (light blue) were higher than the controls (gray), whereas the methylation value of PKM2 in high-PKM2 patients (red) were significantly lower than the controls and the low-PKM2 patients. c There was no difference of copy number variation between high- and low-PKM2 patients. d Heatmap of 1492 metabolic genes in 371 patients (TCGA data). The hierarchical clustering results suggested the expression levels of global metabolic genes were divided into clustering group I (blue) and clustering group II (red). Statistical difference of PKM2 expression, sex, age, grade and stage between the two groups showed in Additional file 1: Tables S3 and S4. e Heatmap of 1319 metabolic genes in 225 patients (GSE14520, validation dataset 1). f Heatmap of 1490 metabolic genes in 268 patients (GSE25097, validation dataset 2). These two hierarchical clustering results validated the expression profiles of metabolic genes were different between high- and low-PKM2 patients. Statistical significance: * P < 0.05, ** P < 0.01, *** P < 0.001

