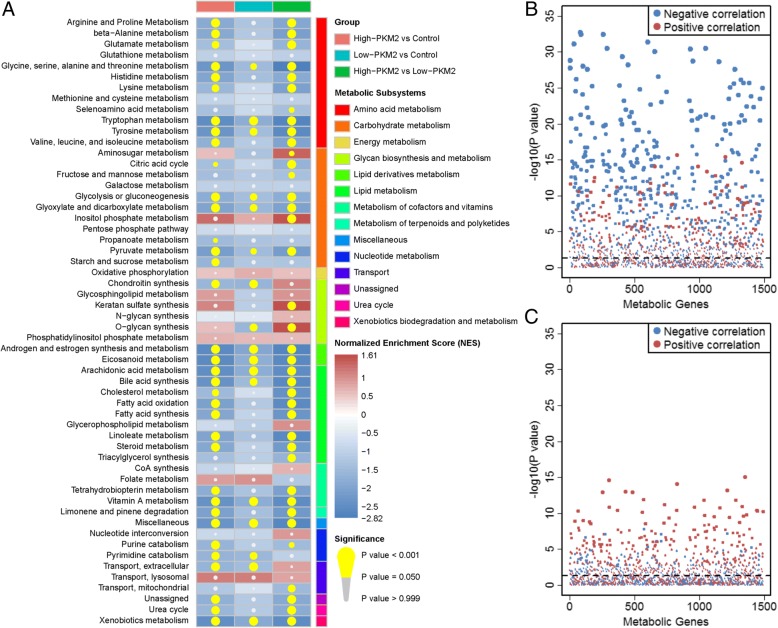
Fig. 2.
Metabolic subsystem enrichment results and correlation between PKM2 and metabolic genes. a Metabolic subsystem enrichment analysis of high-PKM2 vs. controls, low-PKM2 vs. controls and high-PKM2 vs. low-PKM2. The red box represents the metabolic subsystem is up-regulated and the blue box represents the metabolic subsystem is down-regulated. The yellow circle indicates the metabolic subsystem is significantly enriched. b Correlation of PKM2 and metabolic genes in the high-PKM2 group. c Correlation of PKM2 and metabolic genes in the low-PKM2 group. The red points represent positive correlations, and the blue points represent negative correlations. The absolute values of the correlation coefficients are represented by the size of the points. The horizontal dashed line shows the significant level (P ≤ 0.05)

