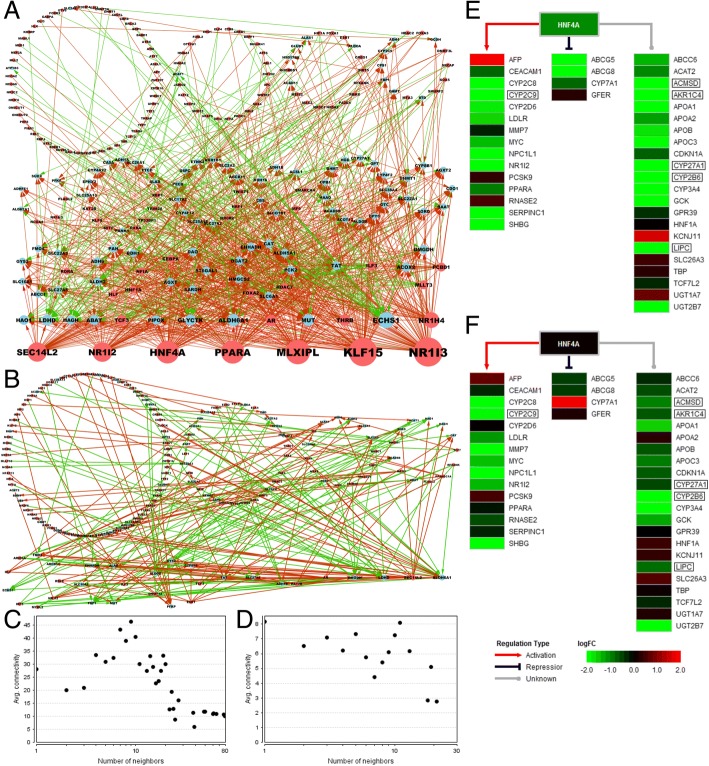
Fig. 6.
Transcriptional regulation relationships in high- and low-PKM2 groups. a Transcriptional regulatory network of risk metabolic genes in high-PKM2 group. b Transcriptional regulatory network of risk metabolic genes in low-PKM2 group. The red circle represents transcription factors and the blue circle represents target genes. The red line represents positive correlation and the green line represents negative correlation. The size of the circle indicates the number of nodes. c Neighborhood connectivity in high-PKM2 group. d Neighborhood connectivity in low-PKM2 group. e HNF4A and its target genes in high-PKM2 group. f HNF4A and its target genes in low-PKM2 group. The gradient color from red to green is expressed as the logFC value of each gene. The red, blue and gray lines show the type of HNF4A regulation on its targets. PKM2-correlated and survival risk genes are shown in the box

