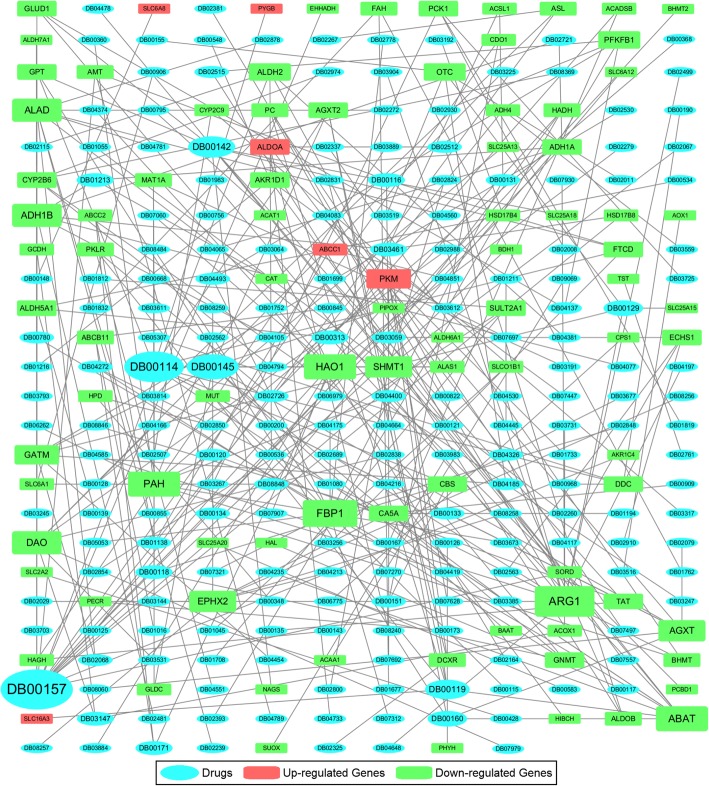
Fig. 7.
Network of metabolic target genes and drugs. Genes in the network were correlated with PKM2 and survival risk. The network connected genes and drugs if their records were in the DrugBank database. The red rectangle, green rectangle and light blue ellipse represent up-regulated genes, down-regulated genes and drugs, respectively. The node size is proportional to the number of connections

