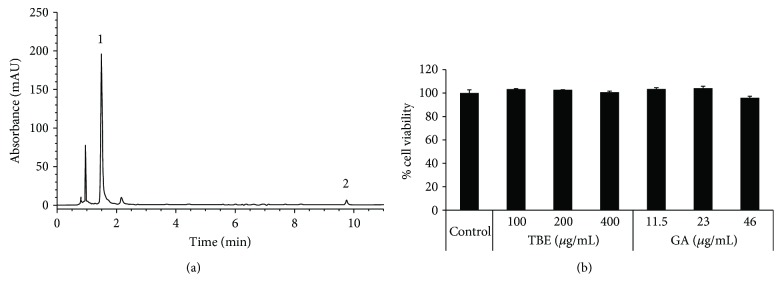
Figure 1.
HPLC-ESI/MS chromatogram of TBE solution and effects of TBE and GA on cell viability in macrophages. (a) Peaks indicate (1) gallic acid and (2) ellagic acid. (b) RAW 264 cells were treated with 100–400 μg/mL TBE or 11.5–46 μg/mL GA for 8 h, and then cell viability was determined by MTT assay. Data represent mean ± SD, n = 3.

