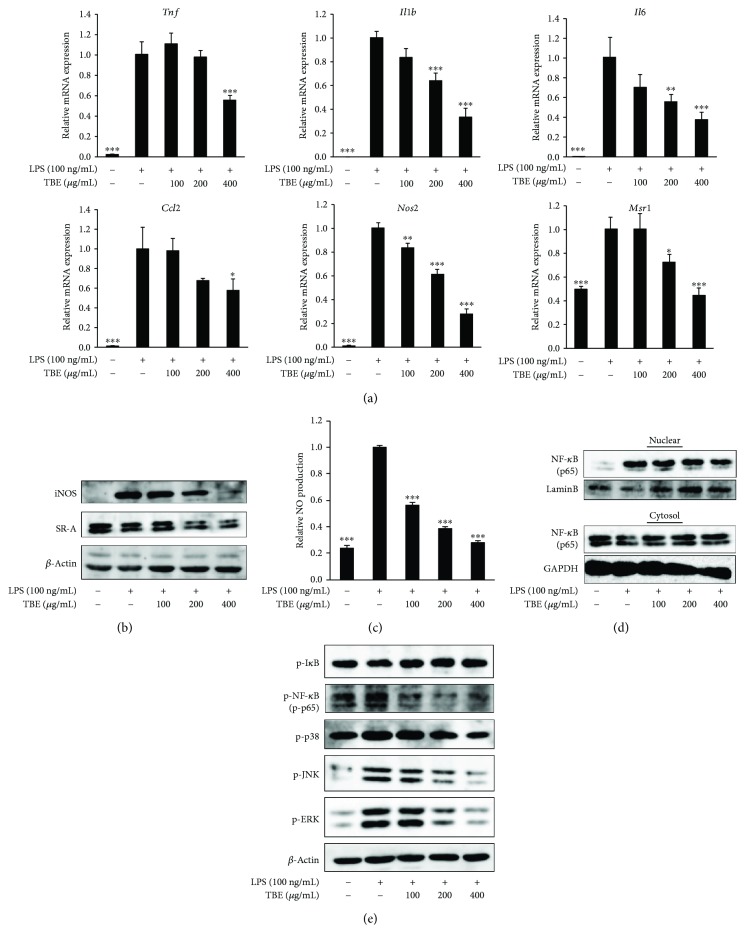
Figure 2.
Effect of TBE on inflammatory mediator expression and inflammatory signaling pathway in LPS-stimulated macrophages. (a) RAW 264 cells were pretreated with 100–400 μg/mL TBE for 1 h, followed by treatment with 100 ng/mL LPS for 4 h. The mRNA levels of Tnf, Il1b, Il6, Ccl2, Nos2, and Msr1 were detected by real-time RT-PCR. (b, c) RAW 264 cells were pretreated with 100–400 μg/mL TBE for 1 h, followed by treatment with 100 ng/mL LPS for 6 h. (b) The protein levels of iNOS and SR-A were detected by Western blotting. (c) NO levels in the culture medium were measured using DAF-2. (d) RAW 264 cells were pretreated with 100–400 μg/mL TBE for 1 h, followed by treatment with 100 ng/mL LPS for 2 h. NF-κB activation was determined by measuring cytosolic and nuclear p65 levels. (e) RAW 264 cells were pretreated with 100–400 μg/mL TBE for 1 h, followed by treatment with 100 ng/mL LPS for 0.5 h. NF-κB and MAPK activation were assessed by measuring p-IκB, P-NF-κB, p-p38, p-JNK, and p-ERK. Data represent mean ± SD, n = 3 (∗ p < 0.05, ∗∗ p < 0.01, ∗∗∗ p < 0.001 compared to LPS group).

