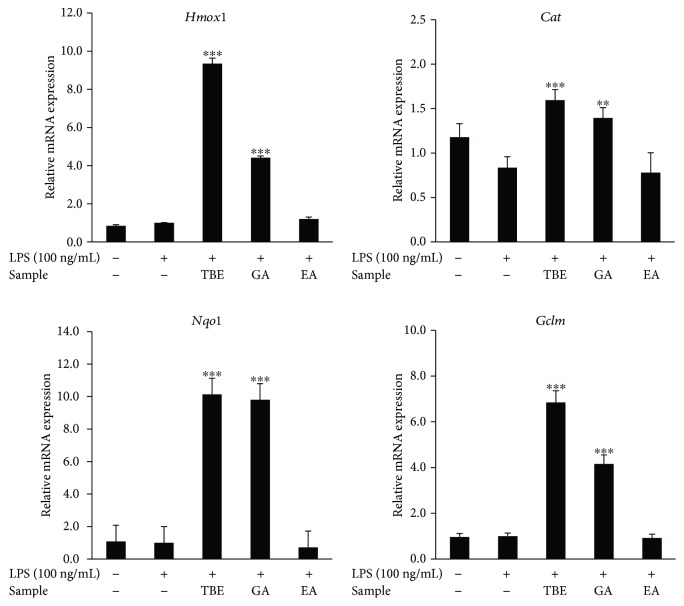
Figure 6.
Effects of TBE, GA, and EA on antioxidant enzyme expression in LPS-stimulated macrophages. RAW 264 cells were pretreated with 400 μg/mL TBE, 46 μg/mL GA, or 1.6 μg/mL EA for 1 h, followed by treatment with 100 ng/mL LPS for 4 h. The mRNA levels of Hmox1, Cat, Nqo1, and Gclm were detected by real-time RT-PCR. Data represent mean ± SD, n = 3 (∗∗ p < 0.01, ∗∗∗ p < 0.001 compared to LPS group).

