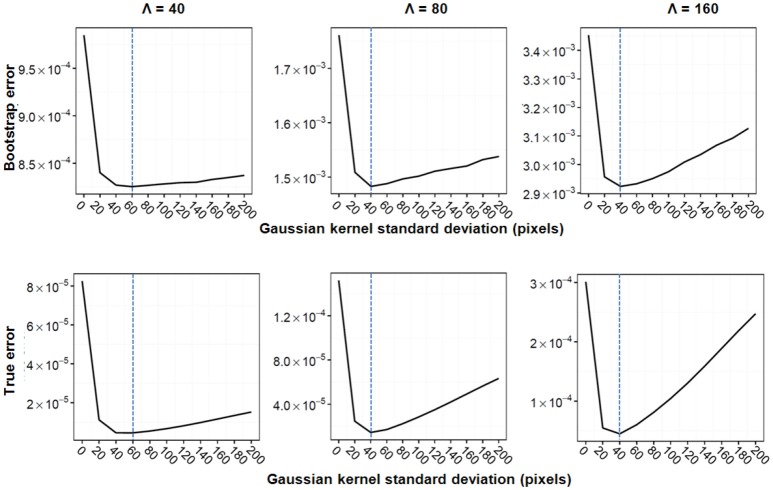
Figure 3.
Gaussian kernel standard deviation selection for the three simulation experiments. Bootstrap error (Top) and true error (Bottom) are shown for the exacerbated group. From left to right: Λ = 40, Λ = 80, Λ = 160. The bootstrap error was calculated using 1000 bootstrap samples. Ten Gaussian kernel sizes were tested, minima are indicated with a dashed blue line.

