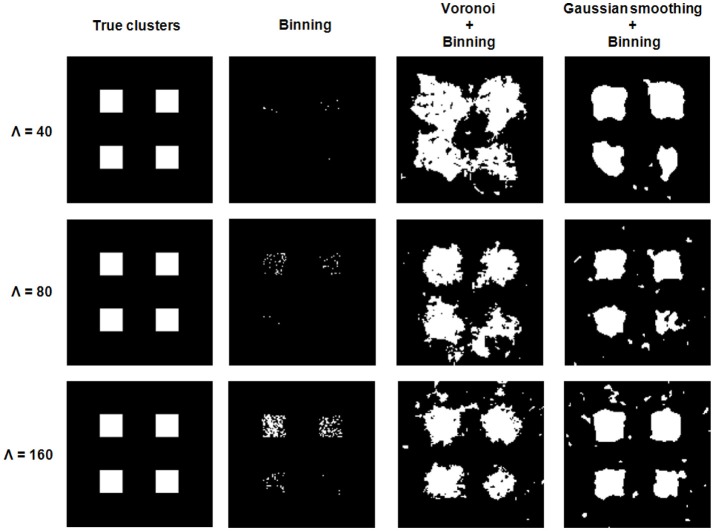
Figure 4.
Cluster detection for the three simulation experiments. Each experiment consists of 10 images from the control group and 10 images from the exarcerbated group. From left to right: Location of the true clusters, clusters detected via binning alone, Voronoi tesselation combined with binning and Gaussian smoothing combined with binning.

