Figure 6.
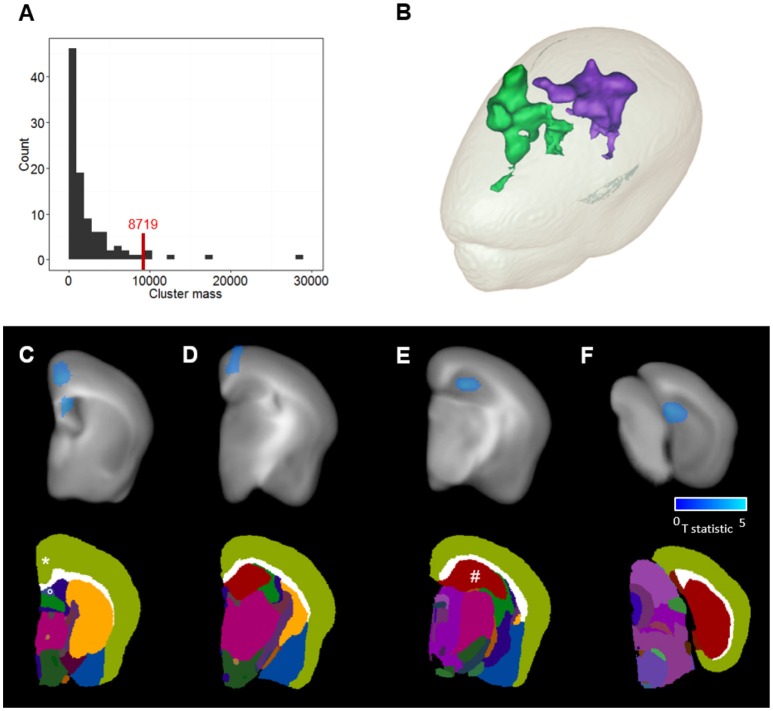
Clusters detection and anatomical localization. (A) Permutation-based cluster mass distribution under the null-hypothesis. The red line corresponds to the significance threshold at a risk α = 0.05. (B) 3D mesh representation of the two clusters where the Aβ load is reduced in APPSwe, Ind-Cre-ADAM30 mice compared to APPSwe, Ind-ADAM30. Green corresponds to the cortical cluster and purple corresponds to the hippocampal cluster. (C–F) Top: T statistic values within the clusters are shown in blue and overlaid with the anatomical template at selected coronal levels of the brain. Bottom: the MICe brain atlas at the same coronal levels. Clusters are localized in (C) the retrosplenial area of the cortex (*), the lateral septal nucleus (°), (D) the cingulate area of the cortex and (E,F) the dentate gyrus of the hippocampal region (#).

