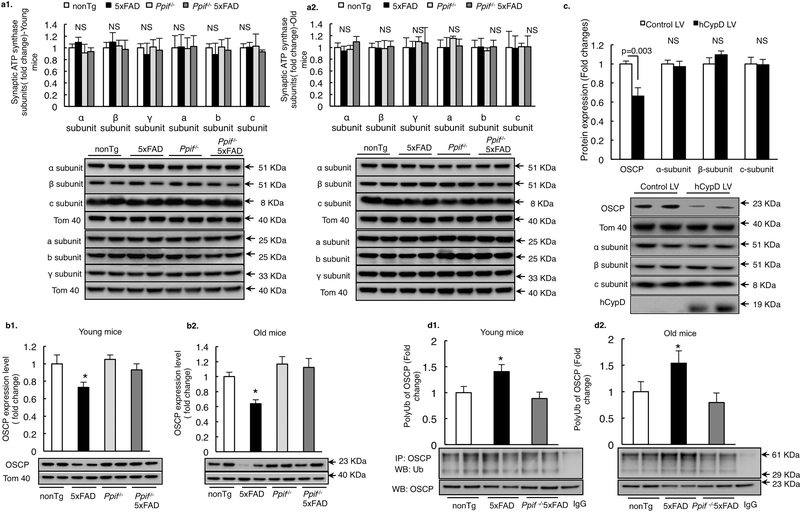
Figure 3. CypD promotes OSCP loss via ubiquitination in 5×FAD mice.
(a)Densitometric quantification of the immunoreactive bands of major F1Fo ATP synthase subunits including α, β, c, a, b, γ subunits in synaptic mitochondria of young and old nonTg, Ppif−/− mice and their AD counterparts. n=6–10 mice per group. The lower panels are representative immunoreactive bands. Tom40 was used as the loading control.*P<0.05 vs other groups. (b) Densitometric quantification of the immunoreactive bands of OSCP in synaptic mitochondria of young and old nonTg, Ppif−/− mice and their Aβ-expressing counterparts. n=6–10 mice per group. The lower panels are representative immunoreactive bands. Tom40 was used as the loading control.*P<0.05 vs other groups. (c) OSCP expression was downregulated in primary cultured mouse neurons by hCypD overexpression. Other major F1Fo ATP synthase subunits like α, β and c subunit displayed no change in expression. The lower panels are representative immunoreactive bands of indicated proteins. Tom 40 was used as the loading control. n=3 independent experiments. (d) Mouse brain mitochondria from nonTg, 5×FAD and Ppif−/− 5×FAD mice were subjected to immunoprecipitation with OSCP antibody followed by immunoblotting with ubiquitin and OSCP. Results are representative from 6 mice per group for both young and old age. *P<0.05 vs other groups. Error bars represent s.e.m.

