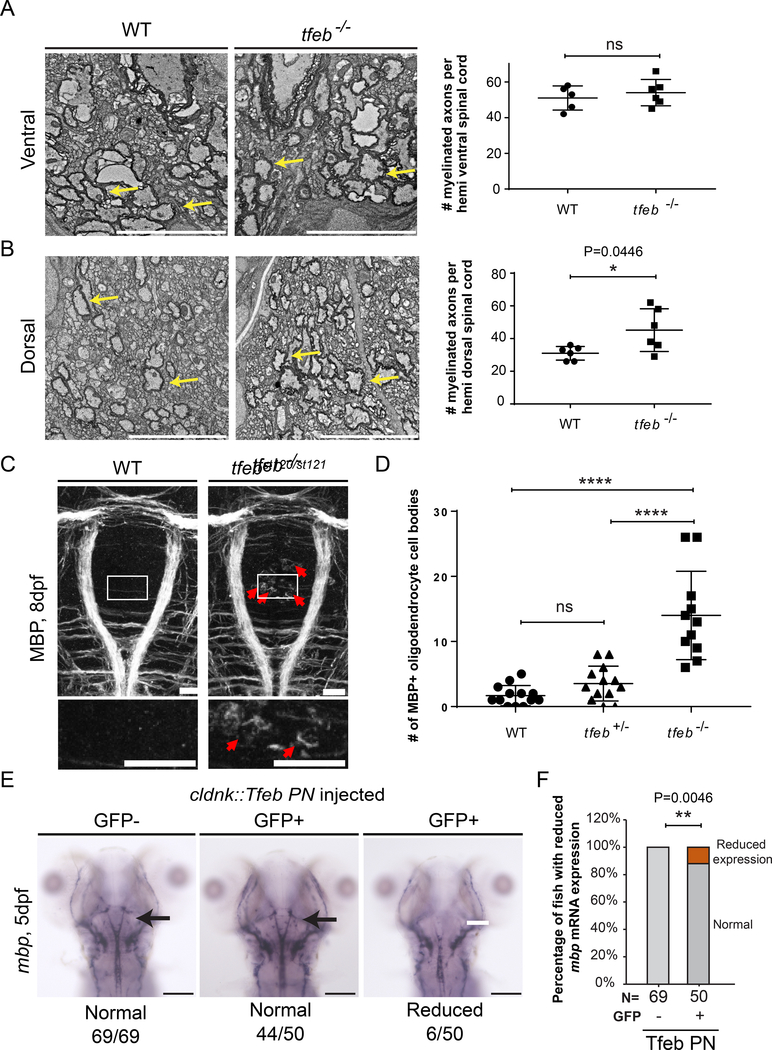
Figure 4. TFEB represses myelination in the CNS.
(A,B) TEM images of transverse sections of the spinal cord at 9 dpf show an increased number of myelinated axons in the dorsal spinal cord of tfeb mutants. Quantification of the number of myelinated axons per ventral (A) or dorsal (B) hemi spinal cord is shown on the right. Graph depicts average values and standard deviation; individual measurements are also shown. Yellow arrows indicate myelinated axons. Scale bar =5 μm. (Statistical analysis: Two-tailed unpaired t-test with Welch’s correction). 3 wildtype and 4 tfeb−/− mutant animals were analyzed. (C) Dorsal view of the hindbrain of 8 dpf larvae shows robust expression of MBP protein in myelinating oligodendrocyte processes in wild type and tfeb−/− mutants, and ectopic expression of MBP protein in tfeb−/− mutant cell bodies (red arrows). Scale bar = 50 μm. (D) Quantification of the number of ectopic MBP positive cells in tfeb−/− mutants (tfeb−/−, n=11) and siblings (n=13 for wildtype and tfeb+/− heterozygotes) (Pairwise comparisons using one-way ANOVA, Tukey posthoc test significant interaction p<0.0001 ****); bars represent standard deviation values. Individual values are also depicted. Genotypes of all animals shown were determined by PCR after imaging. (E) Whole mount in situ hybridization analysis of mbp mRNA expression in 5 dpf fish following transgenic expression of phosphorylation-null Tfeb (Tfeb NP) under the control of claudink promoter. mbp mRNA expression is reduced in some fish overexpressing the construct. (F) Quantification of the percentage of fish with reduced mbp mRNA expression. (Statistical analysis: Fisher’s exact test, two tailed, p< 0.01 **).

