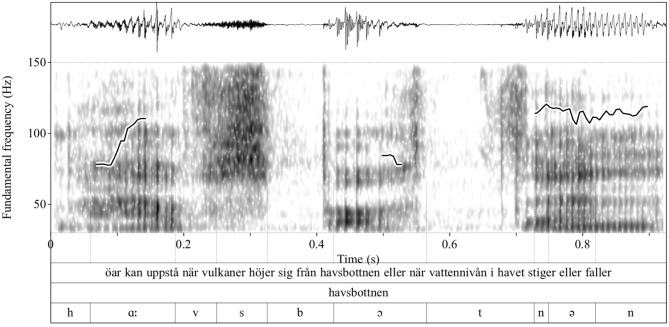
Figure 1.
Waveform, spectrogram, and F0 contour—superimposed on the spectrogram—of an example utterance (upper tier). Shown in the plot is the segmentation of the word havsbottnen “seabed” (middle tier); the individual sounds are shown in the lowest tier. Sound boundaries are indicated with thin vertical lines. The ordinate shows the F0 values whereas the abscissa shows the time in second.

