. 2018 Jul 30;18(18):2838–2848. doi: 10.1039/c8lc00417j

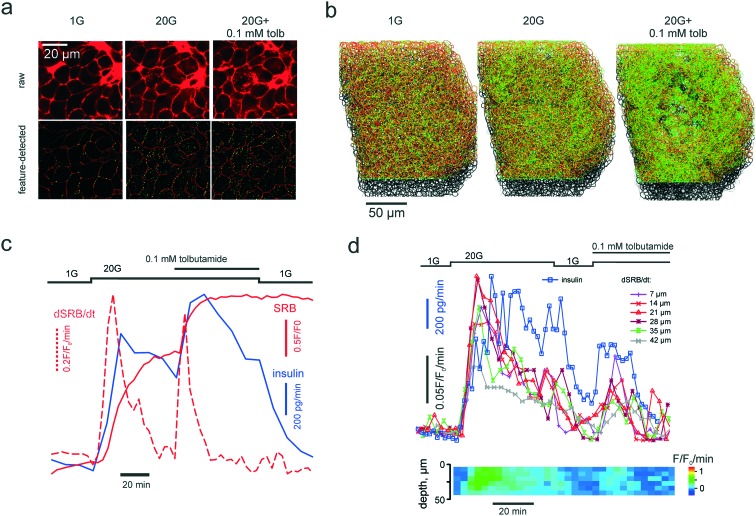
Fig. 3. PAPT reflects the macroscopic secretory kinetics. (a) top: Raw unprocessed images of cells within the islet of Langerhans, exposed to extracellular solution containing 1 mM glucose and 20 mM glucose in the absence and presence of tolbutamide, as indicated. (a) bottom: Images after feature detection, presenting the extracellular space (“cell borders”) (red) and PAPT maxima (green). (b) Rendering of 3-D images of the whole islet after the feature detection, color-coded as in (a) bottom. (c) and (d) Kinetics of the endocytosis imaged in a single islet simultaneously with quantification of total insulin secretion (using RIA) showing the global figures (c) and the in-depth contribution of tissue layers and phasic changes in insulin secretion (d).

Fig. 3