. 2018 Oct 12;10(44):20640–20651. doi: 10.1039/c8nr06738d

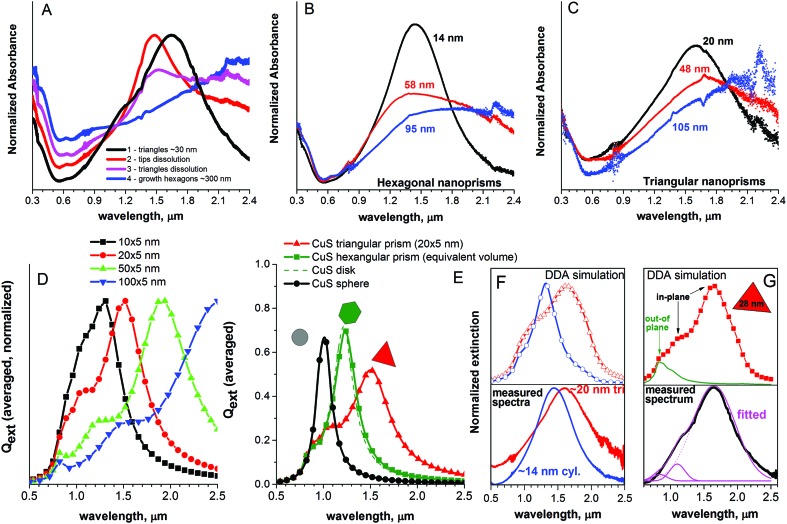
Fig. 7. UV-VIS-NIR spectroscopic characterization of the synthesized CuS NCs supported by DDA simulations: (A) temporal evolution of the absorption spectrum of CuS NCs during the synthesis through size and shape transformations described in the main text. Primarily, small triangular nanoprisms of ∼30 nm appear (curve 1), with subsequent dissolution of the tips (curve 2) and dissolution of former triangles (curve 3) during the growth of large hexagonal NSs in non-kinetic mode and start to dominate; finally, only the large hexagonal NSs (∼300 nm) remain in the product of the reaction (curve 4). Simulated by the DDA method, the spectra for these particles are presented below in (D) and (E). (B) Absorption spectra of quasi-hexagonal nanoprisms (rounded side facets) prepared separately with sizes between 13 and 95 nm. (C) Absorption spectra of triangular nanoprisms (20–105 nm). (D–E) Simulated extinction spectra of CuS NCs with different shapes and sizes. Here, the results were averaged over 15 spatial orientations (ωp = 4.4 eV, ε = 8.0, γ0 = 0.2). (D) Triangular nanoprisms with an edge length of 10, 20, 50 and 100 nm and a thickness of 5 nm. (E) Comparison of the extinction spectra of the triangular prism (edge 20 nm, thickness 5 nm) with the hexagonal prism (thickness 5 nm), disk (thickness 5 nm) and sphere of CuS with equivalent volume (15 600 dipols). (F) Comparison of the measured LSPR peak of the smallest CuS NCs (disks, base diameter 14 nm, thickness 4 nm and triangles 20 × 4 nm) with a simulated spectrum in the NIR region. (G) Comparison of the measured LSPR peak (black curve) with the simulated one (red) for 28 × 4.6 nm triangular nanoprisms with the assignment of out-of-plane resonance (green curve) and the corresponding mathematical fitting of the experimental spectrum with three Gaussian curves centered at resonance positions found by the simulations (pink curves).

Fig. 7