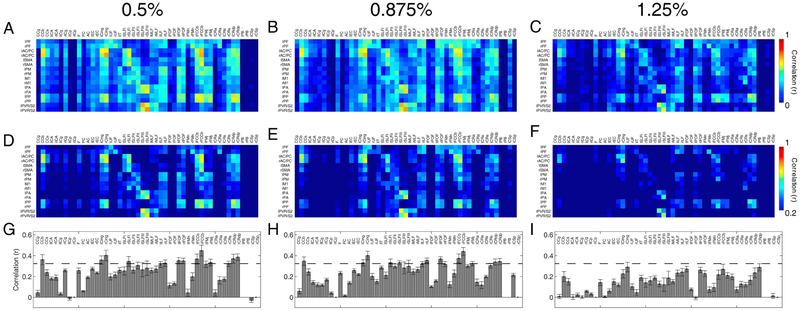
Figure 3:
Connectivity matrices between identified gray matter regions and WM tracts at different anesthesia levels. Pixels from each matrix represent Pearson’s correlation values. Resting-state connectivity patterns between specific WM bundles and cortical regions were computed at 0.5%, 0.875% and 1.25% isoflurane levels with n=8, 10, and 9 runs respectively (N=3 monkeys) thresholded at (A-C) r=0 and (D-F) r=0.2. (G-I) Averaged correlations across cortical regions to white matter tracts for each anesthesia level. Error bars on the bar plots represent standard error of mean while dashed line cuts through the bar plots at r=0.35.

