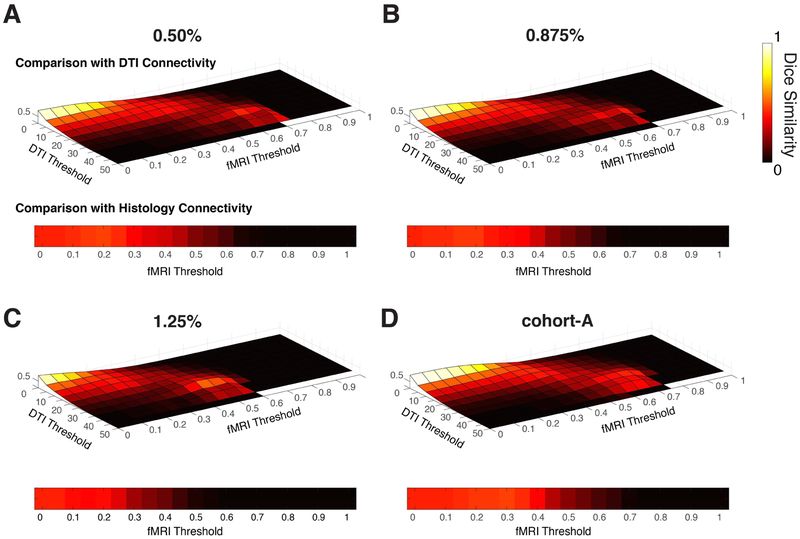
Figure 5:
Quantitative comparisons of rsfMRI with DTI and histological connectivity matrices. Sørensen-Dice measurements were computed for squirrel monkeys acquired at (A) 0.50%, (B) 0.875%, (C) 1.25% and for (D) cohort-A. (Top row of each subplot) DTI-to-rsfMRI Dice coefficients for varying DTI and fMRI thresholds. (Bottom of each subplot) Histology-to-rsfMRI Dice coefficients for varying fMRI thresholds.

