
Figure 3.
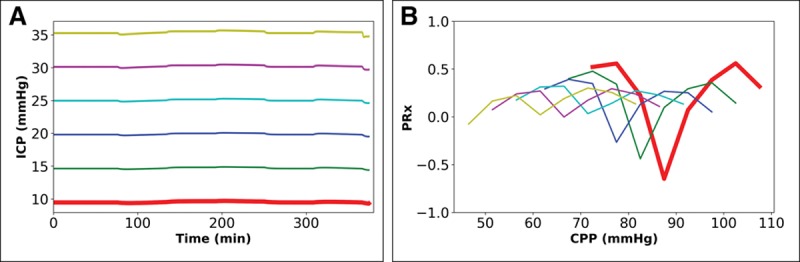
Impact of fixed change in mean intracranial pressure (ICP) profile over 6 hr when cerebral autoregulation is intact and Paco2 is 40 mm Hg. Paired graphs with input ICP profiles (A) and output cerebral perfusion pressure (CPP) ICP-to-blood pressure (BP) Fisher-transformed Pearson’s correlation (PRx) plots before final curve fitting (the BP profile is the same in all simulations). A, The effect of injection of fluid into the cerebrospinal fluid space at six different rates (0.0–0.05 mL/s) to raise mean ICP to six constant levels (10, 15, 20, 25, 30, and 35 mm Hg). B, Output PRx-plots for profiles in (A) showing shift similar to that seen with fixed alteration in BP (Fig. 2B for comparison; for results of final mathematical transformation to calculate optimal CPP, see Table S1, Supplemental Digital Content 3, http://links.lww.com/CCM/E36).