
Figure 5.
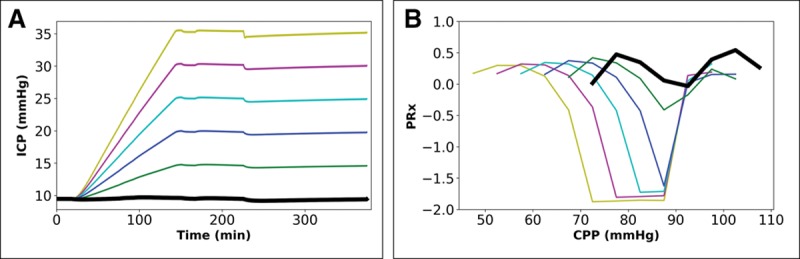
Impact of escalation in intracranial pressure (ICP) profile over 6 hr to a terminal plateau when cerebral autoregulation is intact and Paco2 is 40 mm Hg. Paired graphs with input ICP profiles (A) and output cerebral perfusion pressure (CPP) ICP-to-blood pressure (BP) Fisher-transformed Pearson correlation (PRx) plots before final curve fitting (the BP profile is the same in all simulations). A, Five patterns of escalation in ICP (color-coding similar to Fig. 3, see text for details). B, Output PRx-plots for profiles in A, showing shift in curves (for results of final mathematical transformation to calculate optimal CPP, see Table S1, Supplemental Digital Content 3, http://links.lww.com/CCM/E36).