
Fig. 3.
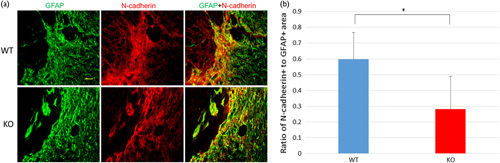
Digital images of sections stained for glial fibrillary acidic protein (GFAP; green) and N-cadherin (red) on day 42 after spinal cord injury (SCI; scale bar=40 µm). (a) The expression of GFAP and N-cadherin is observed in both groups, but the width of the N-cadherin-positive area overlapping the GFAP-positive area is smaller in the knockout (KO) mice than in the wild-type (WT) mice. (b) The ratio of N-cadherin to GFAP staining at the injured site is significantly smaller in the WT mice than in the KO mice (*P<0.05, Student’s t-test).