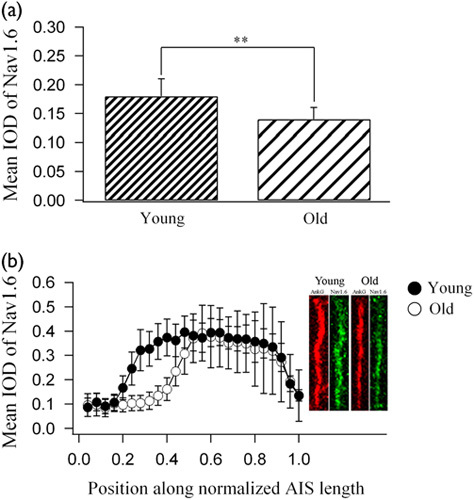
Fig. 4.

Statistics of Nav1.6 immunofluorescence optical density (IOD) within axon initial segments (AISs) of layer II/III neurons in the V1 cortical area of young adult and aged rats. (a) The mean IOD of Nav1.6 within AISs of neurons in aged and young adult rats. (b) The change in the mean Nav1.6 IOD at different positions along normalized AISs of neurons in young adult and aged rats. The point 0.0 on the x-axis denotes the soma position and the point 1.0 denotes the AIS end. The right panel within (b) represents typical samples of AIS (labeled with anti-AnkyrinG) and Nav1.6 fluorescence signals along AISs of young and aged rats. All AISs are normalized to 1.0 in length for the measurement of Nav1.6 fluorescence at different positions along the AIS.
