FIGURE 4.

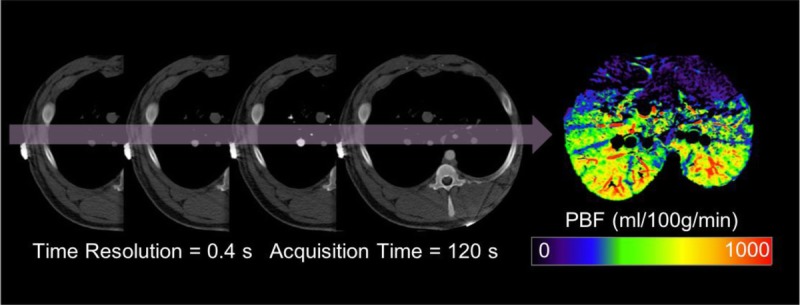
First-pass dynamic computed tomography perfusion. Pulmonary blood flow was calculated via deconvolution of time-attenuation data. Figure 4 can be viewed online in color at www.jcat.org.

First-pass dynamic computed tomography perfusion. Pulmonary blood flow was calculated via deconvolution of time-attenuation data. Figure 4 can be viewed online in color at www.jcat.org.