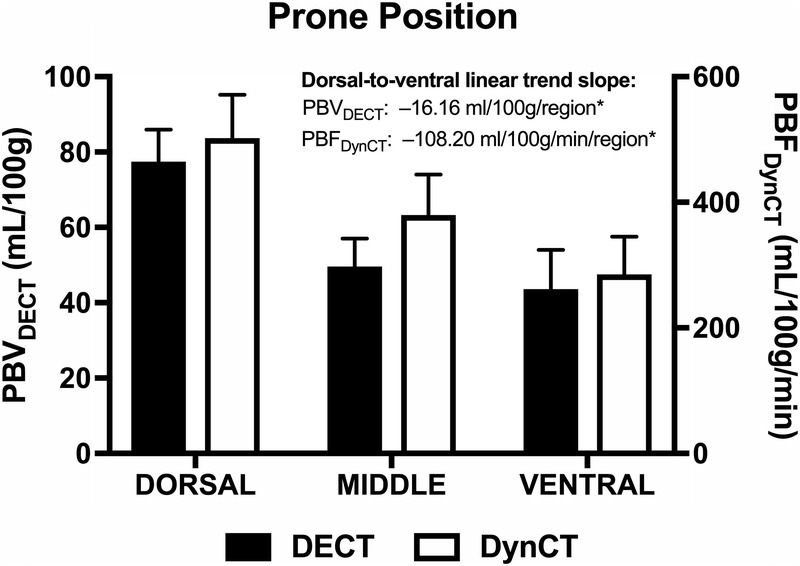
FIGURE 7.

Regional PBVDECT and PBFDynCT. Bar charts show the mean and SE of PBVDECT (black boxes) and PBFDynCT (white boxes) for each lung region (dorsal, middle, and ventral) in the prone position. Trend slopes are indicated. *P < 0.001. Figure 7 can be viewed online in color at www.jcat.org.
