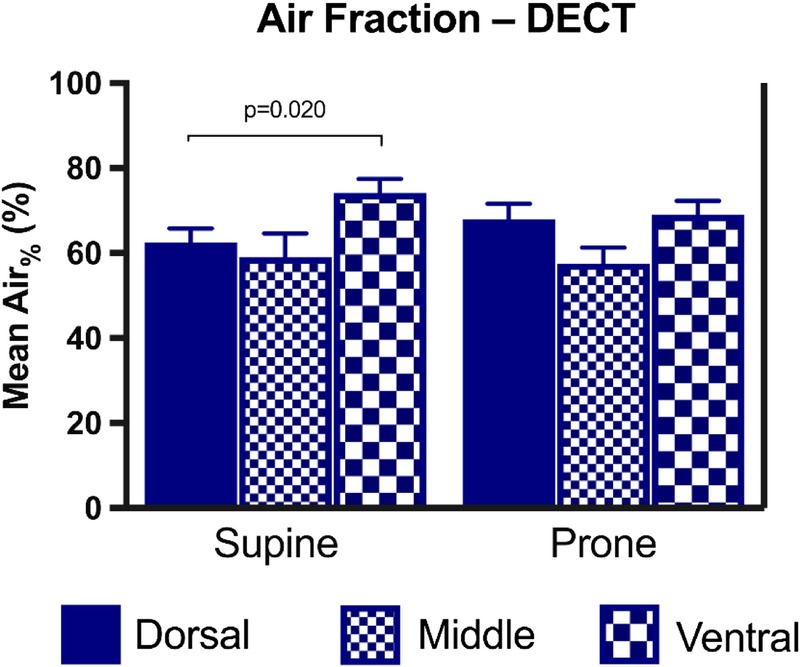
FIGURE 8.

Regional AF (Air%) obtained by material decomposition on DECT. Bar charts showing mean and SE for each lung region (dorsal, middle, and ventral) in the supine and prone positions. Only statistically significant P values are displayed. Figure 8 can be viewed online in color at www.jcat.org.
