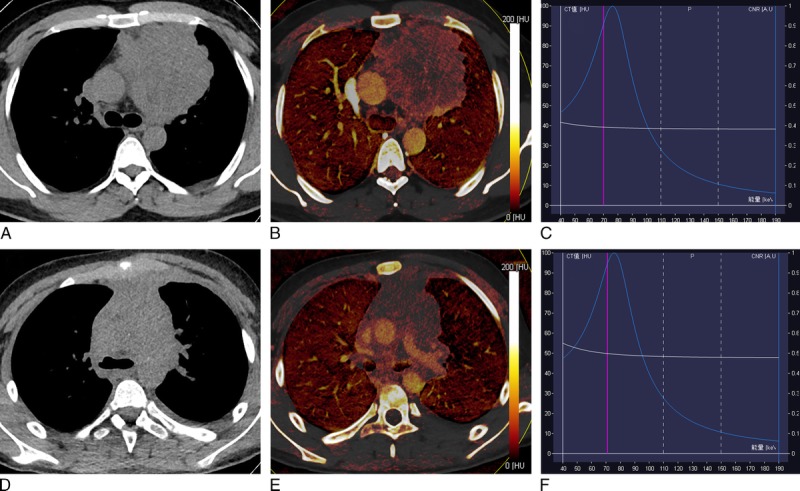
FIGURE 2.

Dual-energy computed tomography images of representative cases with thymic carcinoma and lymphoma. A–C, Thymic carcinoma (squamous cell carcinoma): (A) axial VNC CT image shows anterior mediastinal mass with irregular contour, blurred fat layer of peritumor, and irregular interface with an absent space between tumor and pleura. B, Axial iodine overlay image shows heterogeneously mild to moderate iodine color in tumor, and IHU, IC, and MHU values in venous phase were 10.9 HU, 0.5 mg/mL, and 53.3 HU, respectively; (C) graph of virtual monochromatic HU curves for the same region of interest locations shows less steep descending curve in tumor. D–F, Thymic lymphoma (T lymphoblastic lymphoma): (D) axial VNC CT image shows anterior mediastinal mass with absent fat layer of peritumor, thickening pleura interface, and absent space between tumor and mediastinal blood vessels. E, Axial iodine overlay image shows mild iodine color in tumor, and venous phase IHU, IC, and MHU values were 5.8 HU, 0.7 mg/mL, and 54.1 HU, respectively; (F) graph of virtual monochromatic HU curves for the same region of interest locations shows less steep descending curve in tumor. Figure 2 can be viewed online in color at www.jcat.org.
