
FIGURE 4.
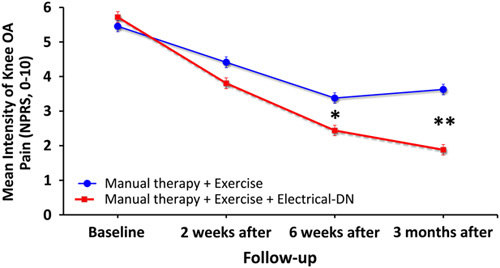
Evolution of knee pain intensity (NPRS, 0 to 10) throughout the course of the study stratified by randomized treatment assignment. Data are means (SE). NPRS indicates Numeric Pain Rating Scale.
Official websites use .gov
A
.gov website belongs to an official
government organization in the United States.
Secure .gov websites use HTTPS
A lock (
) or https:// means you've safely
connected to the .gov website. Share sensitive
information only on official, secure websites.
Evolution of knee pain intensity (NPRS, 0 to 10) throughout the course of the study stratified by randomized treatment assignment. Data are means (SE). NPRS indicates Numeric Pain Rating Scale.