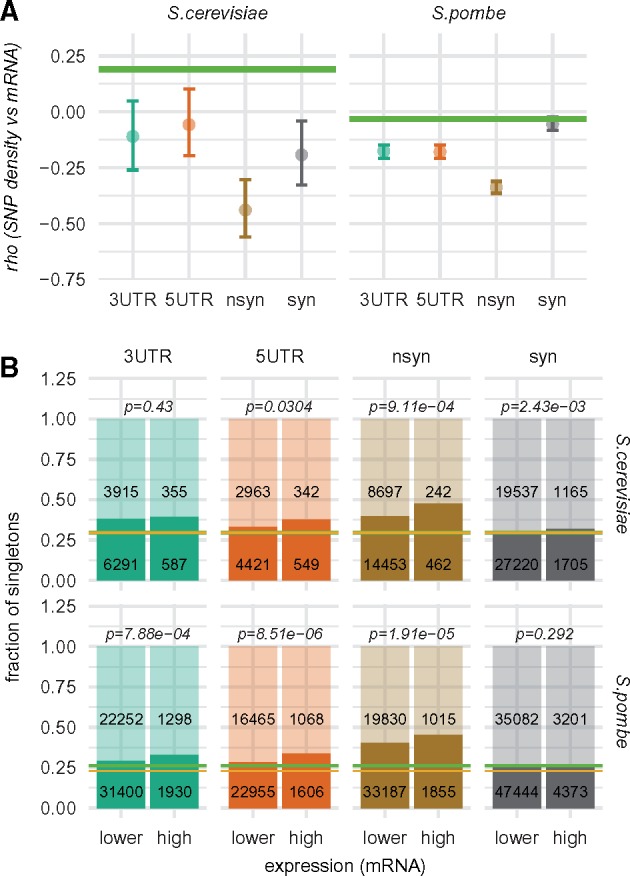
Fig. 3.

—(A) Distribution of the Spearman’s rank correlation coefficients (mRNA level vs variant density) obtained in the subsampling analyses (mean ± 95ci). Green line shows value of the correlation coefficient obtained for all introns; (B) Fractions of singletons within variants present in highly and less extensively expressed genes (see Results for the more detailed description of the used expression categories). Singletons—opaque colors, more frequent variants—transient colors. Numbers of variants within each group are given inside bars. Green line shows fraction of singletons found in introns, yellow line indicates fraction of singletons expected for ideal Wright–Fisher population. Significance of χ2 tests comparing fractions of singletons within variants found in genes belonging to the two expression categories are shown above the bars.
