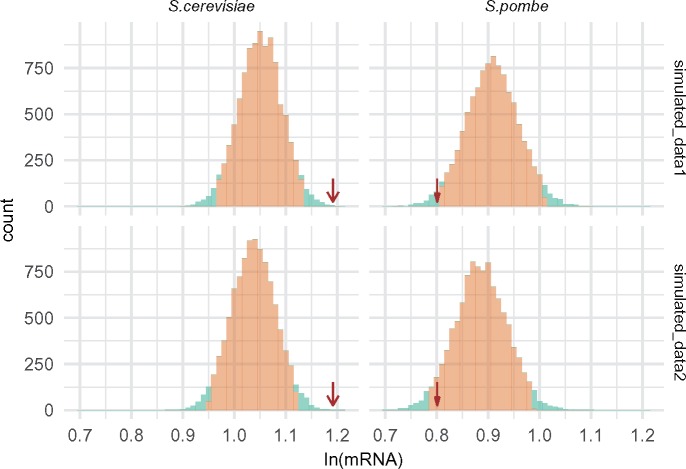
Fig. 4.
—Comparison between the expression of genes mutated in mutation accumulation experiments (EMA statistics, red arrows) and values obtained for simulated data; simulated_data1: probability of mutation within a gene proportional to its length and higher for G and C nucleotides, simulated_data2: probability of mutation proportional to gene length and equal for all nucleotides (See Materials and Methods for details).

