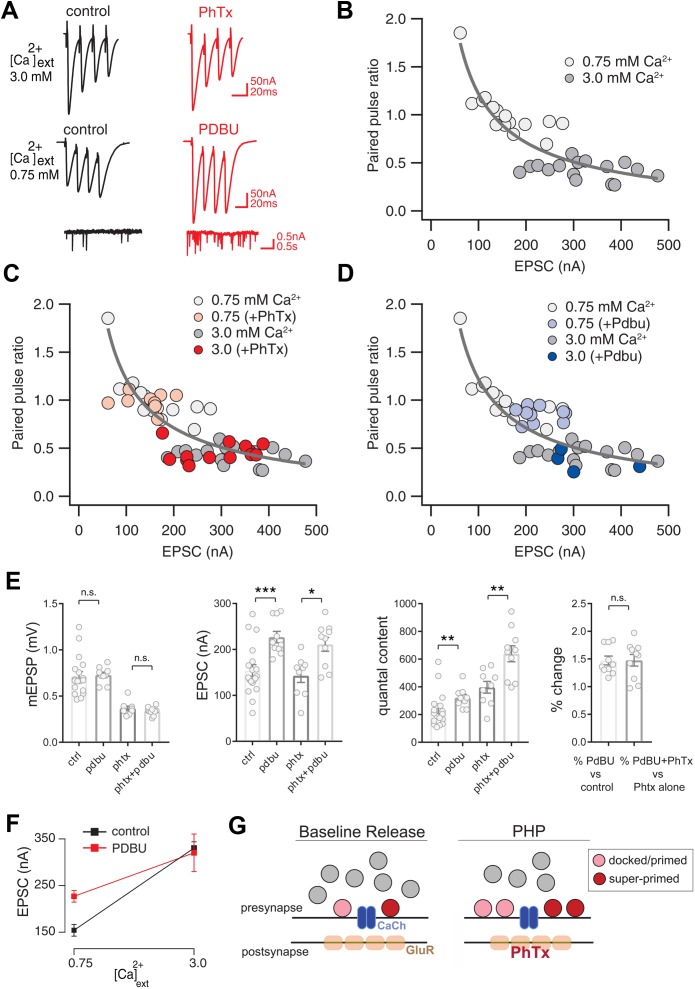
Figure 1. Preservation of Release Dynamics During Presynaptic Homeostatic Plasticity.
(A) Example traces at the indicated external calcium concentration in the presence or absence of PhTx and PdBu. (B) Paired-pulse ratio (EPSC4/EPSC1) versus initial EPSC amplitude (EPSC1) at two external calcium concentrations as indicated. (C) Data from (B) re-plotted (gray) with the addition of data recorded in the presence of PhTx (light and dark red) for indicated external calcium concentrations. (D) Data from (B) re-plotted (gray) with the addition of data recorded in the presence of PdBu (light and dark blue) for indicated external calcium concentrations. (E) Data for mEPSP, EPSC and quantal content for control (ctrl), control in the presence of PdBu (PdBu), control in the presence of PhTx (PhTx) and control synapses incubated in PhTx followed by PdBU (PhTx +PdBu). At right, percent change is calculated as quantal content recorded in the presence of PdBu versus control in the absence of PdBu. (F) EPSC amplitude in the presence (red) and absence (black) of PdBu at the indicated extracellular calcium concentrations. (G) Schematic highlighting the homeostatic doubling of the pool of docked primed vesicles during presynaptic homeostatic plasticity (PHP) in the presence of PhTx. The ratio of primed (light red) to super-primed (dark red) vesicles is held constant, thereby preserving presynaptic release dynamics. ns, not significant; *p<0.05, **p<0.01, ***p<0.001; Data represent mean ±SEM. Student’s t-test, two tailed.
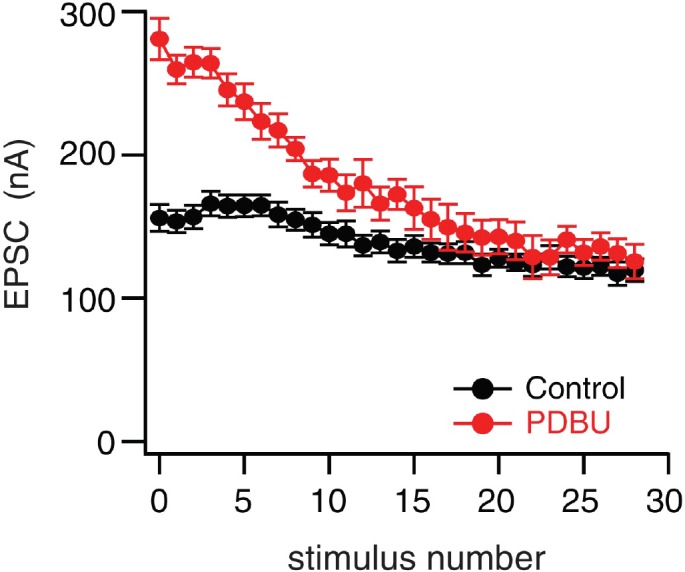
Figure 1—figure supplement 1. PdBu-dependent potentiation converges to wild type steady state during a prolonged stimulus train.


