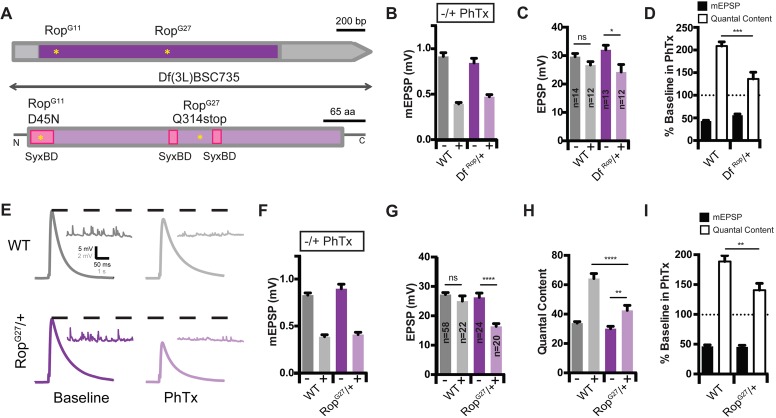
Figure 2. Identification of Rop as a SNARE-Associated Molecule Involved in the Rapid Induction of Presynaptic Homeostasis.
(A) Schematic of the Drosophila Rop gene locus (top) and protein (bottom). Coding exon is shown in dark purple and non-coding DNA is in gray. Protein is shown in light purple. Point mutations in Rop mutant alleles (RopG27 and RopG11) are indicated by yellow stars. Deficiency Df(3L)BSC735 uncovers the Rop gene locus as indicated. Syntaxin-binding domains (SBD) of the Rop protein are shown (pink). (B) Average data for mEPSP amplitude in the absence (baseline) and presence (PhTx) of PhTx for WT and heterozygous deficiency chromosome Df(3L)BSC735 (DfRop/+). PhTx application reduces amplitudes in all genotypes (p<0.01). Data represent mean ± SEM. (C) Average data for EPSP amplitude as in (B); sample sizes for data in (B–D) are shown on bar graph; ns, not significant; *p<0.05; Student’s t-test. (D) Average mEPSP amplitude and quantal content are normalized to values in the absence of PhTx for each genotype. ***p<0.001. (E) Sample traces showing EPSP and mEPSP amplitudes ± PhTx for indicated genotypes. (F–H) Average mEPSP (F) EPSP (G) and Quantal Content (H) for indicated genotypes; ns, not significant; ****p<0.0001; **p<0.01. (I) Average percent change in mEPSP amplitude and quantal content in PhTx compared to baseline for indicated genotypes; **p<0.01. Data are mean ±SEM for all figures. Student’s t-test, two tailed.

