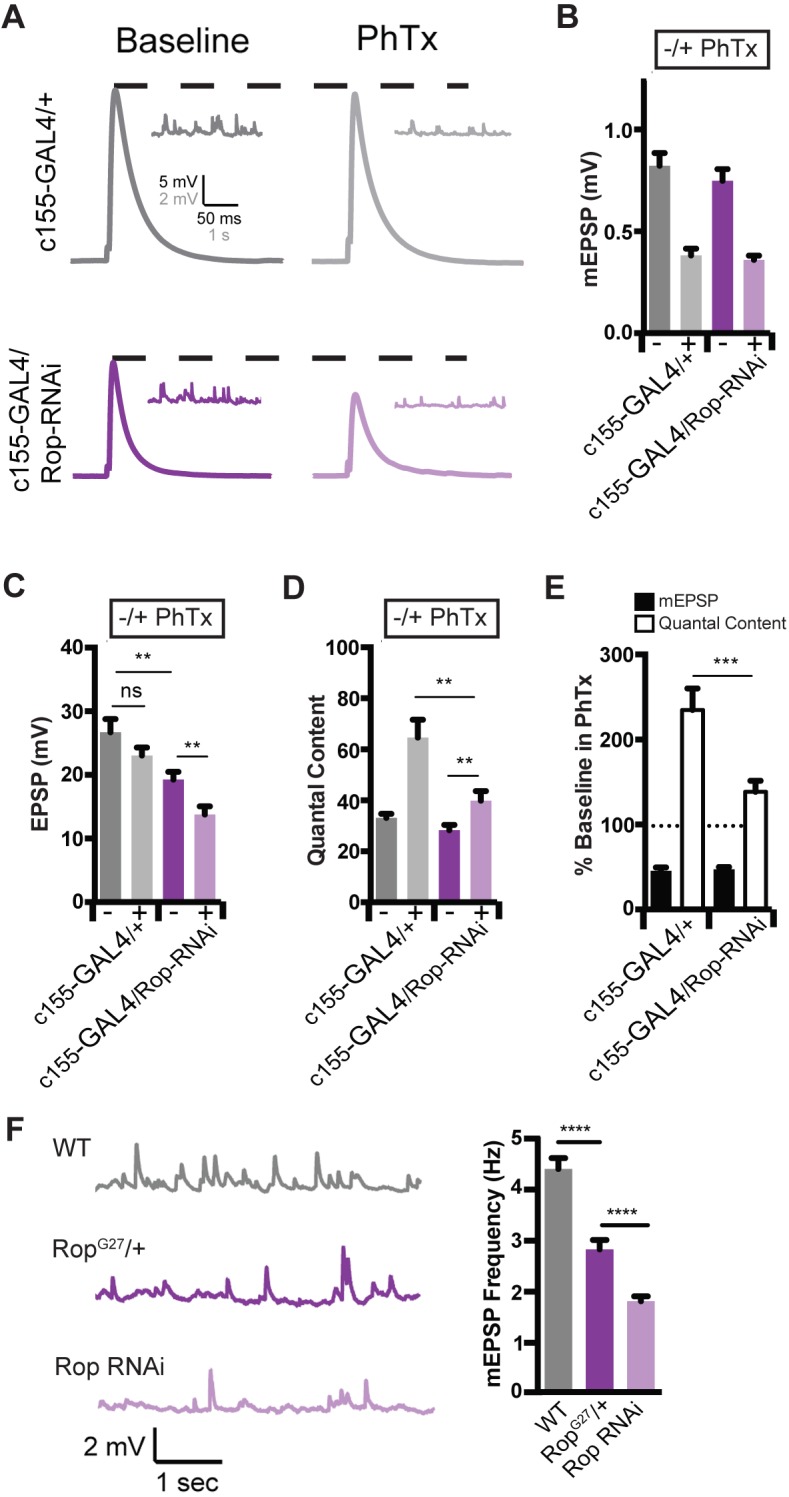
Figure 3. Rop is Required Neuronally During Presynaptic Homeostasis.

(A) Sample traces showing EPSP and mEPSP amplitudes ± PhTx for indicated genotypes. (B) Average data for mEPSP when UAS-Rop-RNAi is expressed pan-neuronally (c155-GAL4)±Phtx as indicated. PhTx reduces amplitudes in all genotypes; p<0.01. (C) Average data for EPSP as in B; ns, not significant; **p<0.01. (D) Average data for Quantal Content as in B; **p<0.01. (E) Average percent change in mEPSP amplitude and quantal content in PhTx compared to baseline for indicated genotypes; ***p<0.001. (F) Sample traces showing mEPSPs for indicated genotypes (left) and average mEPSP frequencies (Hz) (right). Student’s t-test, two tailed.
