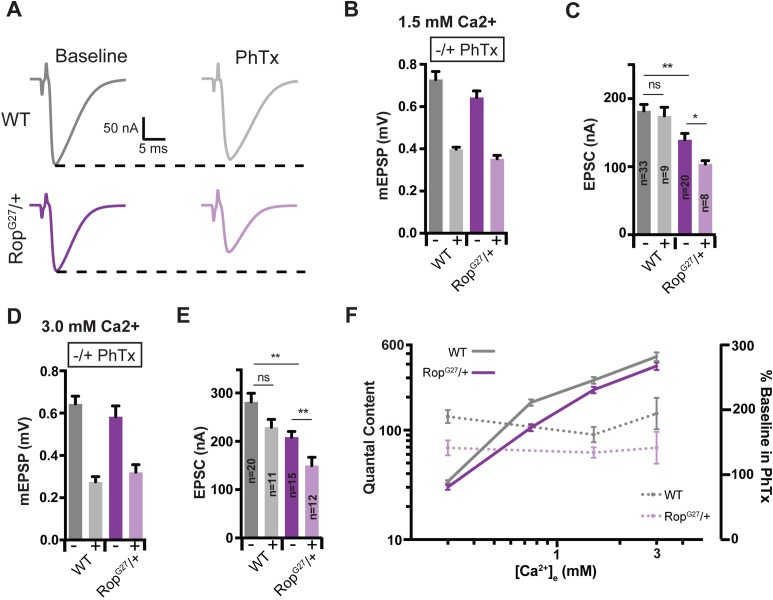
Figure 4. Suppression of Presynaptic Homeostasis is maintained with increased [Ca2+]e in Rop mutants.
(A) Sample EPSC traces in the absence (baseline) and presence (PhTx) of PhTx for WT and heterozygous RopG27 mutant at 1.5 mM extracellular calcium [Ca2+]e. (B) Average data for mEPSP amplitude ± PhTx for indicated genotypes. PhTx application reduces amplitude in all genotypes (p<0.01). Data represent mean ± SEM. (C) Average data for EPSC amplitude as in (B); ns, not significant; **p<0.01, *p<0.05; Student’s t test, two tailed. Sample sizes indicated on bar graph. (D–E) Average mEPSP (D) EPSC (E) ± PhTx for each genotype at 3.0 mM extracellular calcium [Ca2+]e; ns, not significant; **p<0.01; Data represent mean ±SEM. Student’s t-test, two tailed. (F) Relationship between mean quantal content and [Ca2+]e (left axis) and relationship between quantal content normalized to values in the absence of PhTx and [Ca2+]e (right axis) for WT and RopG27 heterozygous mutants.

