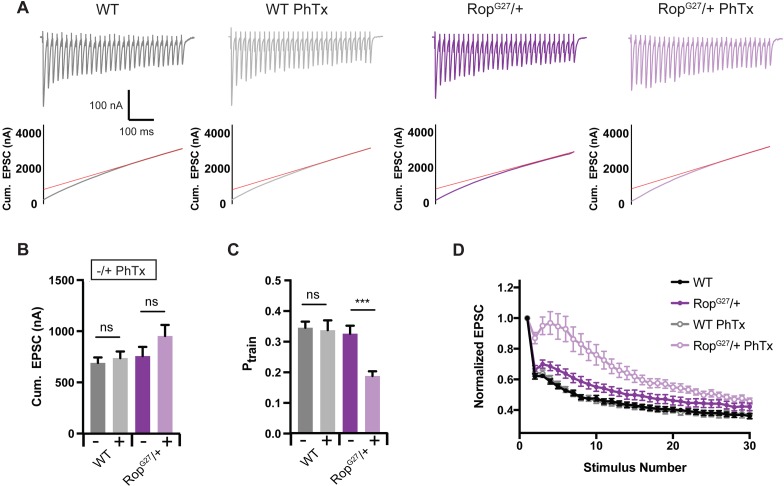
Figure 5. Decreased Release Probability in Rop Mutants.
(A) Sample EPSC traces (top) and cumulative EPSC amplitudes (bottom) ±PhTx for indicated genotypes. Experiment used 60 Hz stimulation (30 stimuli) in 1.5 mM [Ca2+]e. Red line is fit to cumulative EPSC data and back extrapolated to time zero. (B) Average cumulative EPSC amplitudes ± PhTx for indicated genotypes; ns, not significant. Student’s t-test, two tailed. (C) Average Ptrain ±PhTx for indicated genotypes. Ptrain = 1st EPSC/cumEPSC; ns, not significant; ***p<0.001. (D) Average EPSC amplitudes normalized to the first pulse are plotted against stimulus number for indicated genotypes.

