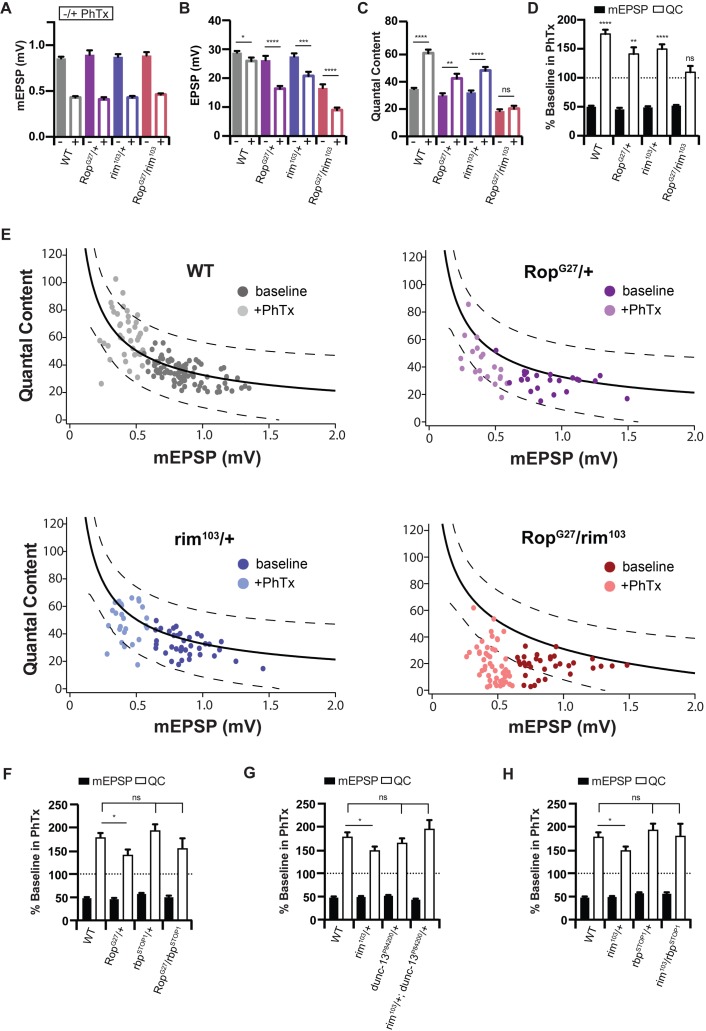
Figure 6. Rop Interacts with rim during Synaptic Homeostasis.
(A) Average data for mEPSP amplitude ±PhTx for WT, heterozygous RopG27/+ mutant heterozygous rim103/+ mutant, and transheterozygous RopG27/rim103 mutant at 0.3 mM [Ca2+]e. PhTx application reduces amplitude in all genotypes (p<0.01). Data represent mean ±SEM. Student’s t test. (B) Average data for EPSP amplitude ±PhTx for indicated genotypes; statistics as in (A); *p<0.05; ***p<0.001; ****p<0.0001, Student’s t-test, two tailed. (C) Average data for Quantal Content ±PhTx for indicated genotypes as in (A); ns, not significant; **p<0.01; ****p<0.0001; Student’s t-test, two tailed. (D) Average data for mEPSP and quantal content normalized to values in the absence of PhTx for indicated genotypes. Statistical comparisons are made within each genotype to baseline in the absence of PhTx. Student’s t-test, two tailed. (E) Each point represents average data from an individual NMJ recording. For WT, recordings in the absence of PhTx are dark gray, those with PhTx are light gray. For RopG27/+, recordings in the absence of PhTx are dark purple, those with PhTx are light purple. For rim103/+, recordings in the absence of PhTx are dark blue, those with PhTx are light blue. For RopG27/rim103, recordings in the absence of PhTx are dark red, those with PhTx are light red. The black line in the WT graph is a curve fit to this control data. The same wild type curve-fit is overlaid on all other genotypes for purposes of comparison. Dotted black lines encompass 95% of wild type data points. These same lines from wild type are superimposed on the graphs for indicated genotypes. (F–H) Average percent change in mEPSP amplitude and quantal content in PhTx compared to baseline for trans heterozygous combinations: RopG27/rbpSTOP1 (F), rim103/+; dunc13P84200/+ (G), rim103/rbpSTOP1 (H); ns, not significant; *p<0.05; Student’s t-test, two tailed.

