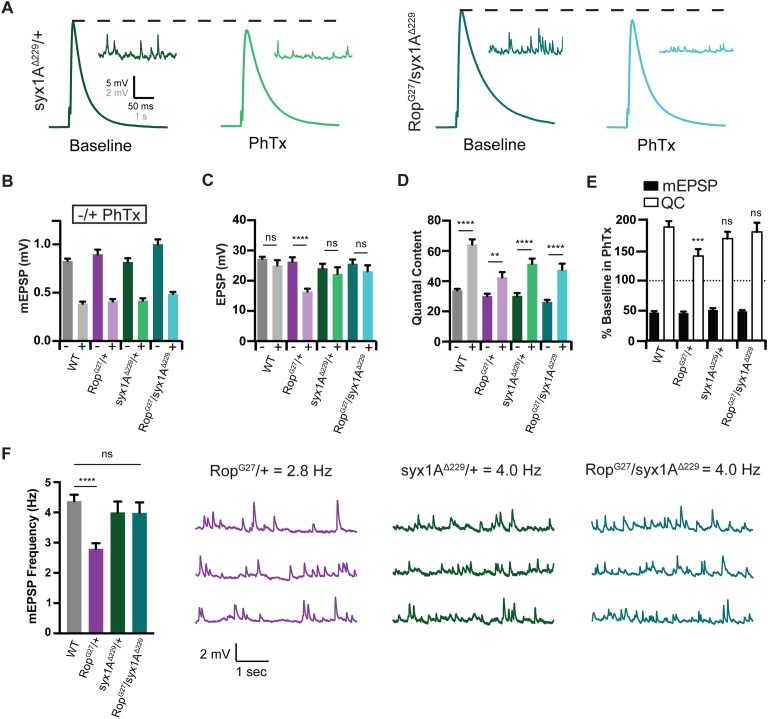
Figure 8. Syx rescues PHP during Synaptic Homeostasis.
(A) Sample traces showing EPSP and mEPSP amplitudes in the absence (baseline) and presence (PhTx) of PhTx for syx1A heterozygous null allele (syx1AΔ229/+) and heterozygous syx1AΔ229 placed in trans with RopG27 mutant (RopG27/syx1AΔ229). (B) Average data for mEPSP amplitude ±PhTx for indicated genotypes. PhTx application reduces amplitude in all genotypes (p<0.01). Data represent mean ±SEM. Student’s t test. (C–E) Average data for EPSP amplitude (C) Quantal Content (D) and mEPSP and quantal content normalized to values in the absence of PhTx (E) for indicated genotypes. Statistical comparisons are made to wild type for each genotype in (E). **p<0.01; ****p<0.0001, Student’s t-test, two tailed. (F) Average mEPSP frequencies (Hz) (left) and sample traces showing mEPSPs for indicated genotypes (right). Student’s t test, two tailed.

