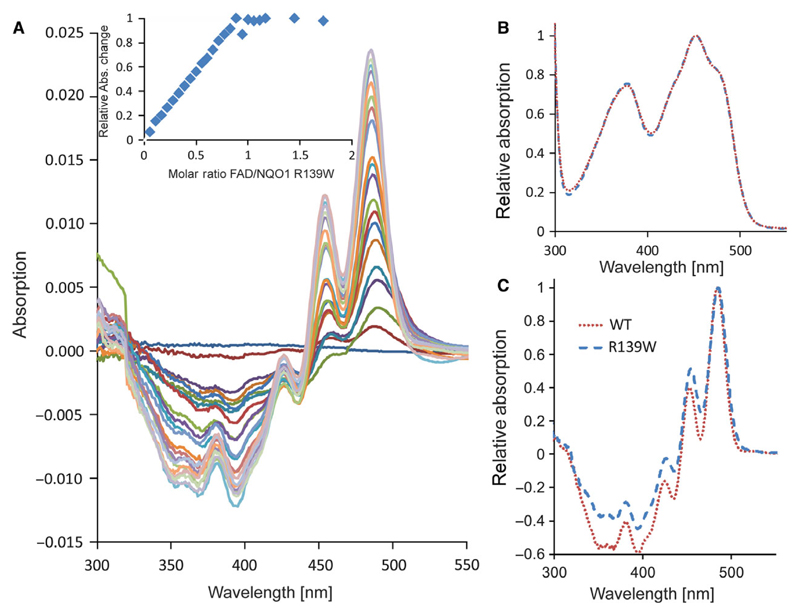
Fig. 1.
UV-visible and difference titration absorption spectra of wild-type NQO1 and NQO1 R139W. (A) Difference titration spectra of 800 μL NQO1 R139W (45 μm) with 0–42 μL in 2 μL intervals FAD (1 mm). The insert shows the change of the absolute absorption values at 436 nm and 455 nm against the FAD/protein molar ratio with two additional points (with additional 10 μL FAD each) compared to the main figure. (B) Absorption spectra of wild-type NQO1 and NQO1 R139W normalized to the maximum at 450 nm. (C) Difference titration spectra of wild-type NQO1 and NQO1 R139W with protein/FAD ratio of 1 normalized to the maximum at 480 nm.

