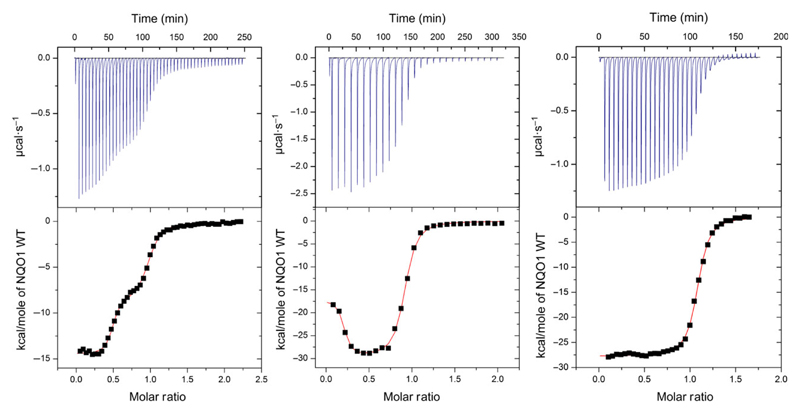
Fig. 3.
Isothermal titration microcalorimetry measurements of NQO1 wild-type in HEPES buffer. The left and the middle measurements were conducted with apo-NQO1 in the sample cell of the microcalorimeter and FAD in the injection syringe. Data was fitted using the two binding site model. Left: First injection with 2 μL and 49 injections with 6 μL of 477 μm FAD solution in 49.4 μm NQO1 apoprotein solution and 300 s spacing at 25 °C. The determined KD and N values are: KD1 = 9.2 nm; KD2 = 780 nm; N1 = 0.47; N2 = 0.5. Middle: First injection with 2 μL and 27 injections with 10 μL of 457 μm FAD solution in 46.8 μm NQO1 apoprotein solution and 600 s spacing at 25 °C. The determined KD and N values are: KD1 = 4 nm; KD2 = 295 nm; N1 = 0.18; N2 = 0.71. The right measurement was conducted with FAD in the sample cell of the microcalorimeter and apo-NQO1 in the injection syringe. Data was fitted using the one binding site model. First injection with 2 μL and 34 injections with 6 μL of 284 μm NQO1 apoprotein solution in 29 μm FAD solution and 300 s spacing at 25 °C. From three independent measurements under the same conditions, the dissociation constant was calculated to KD = 64 ± 23 nm.

