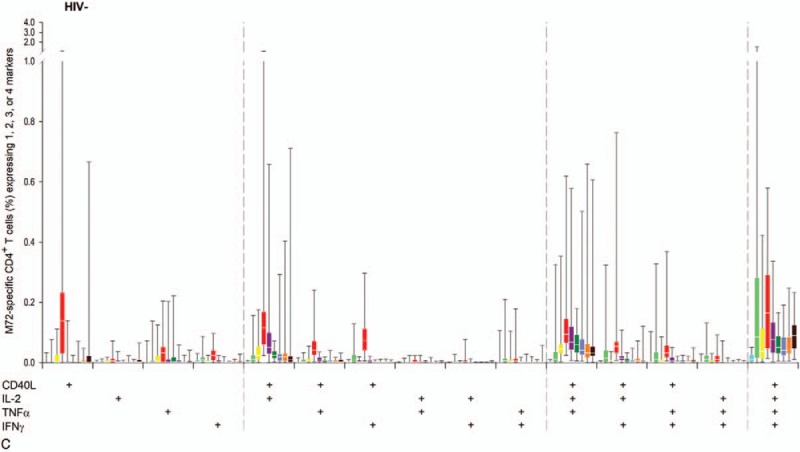
Figure 6 (Continued).

Immune-marker expression profiles following vaccination with M72/AS01E. Data for all participants vaccinated with M72/AS01E and included in the ATP cohort are presented as percentages of M72-specific CD4+ T-cells expressing single immune markers among IFN-γ, IL-2, TNF-α and CD40L of all CD4+ T-cells and any combination of the 4 markers, along with first and third quartiles and minimum and maximum values measured. % = percentage; D7 = 7 days post-dose 1; D30 = 30 days post-dose 1; D37 = 7 days post-dose 2; D60 = 30 days post-dose 2; HIV+ART+ = HIV-positive participants on antiretroviral therapy; HIV+ART- = HIV-positive, antiretroviral therapy-naïve participants; HIV− = HIV-negative participants; M7 = 6 months post-dose 2; Pre = pre-vaccination; Q1 = first quartile; Q3 = third quartile; Y1 = 1 year post-dose 2; Y2 = 2 years post-dose 2; Y3 = 3 years post-dose 2.
