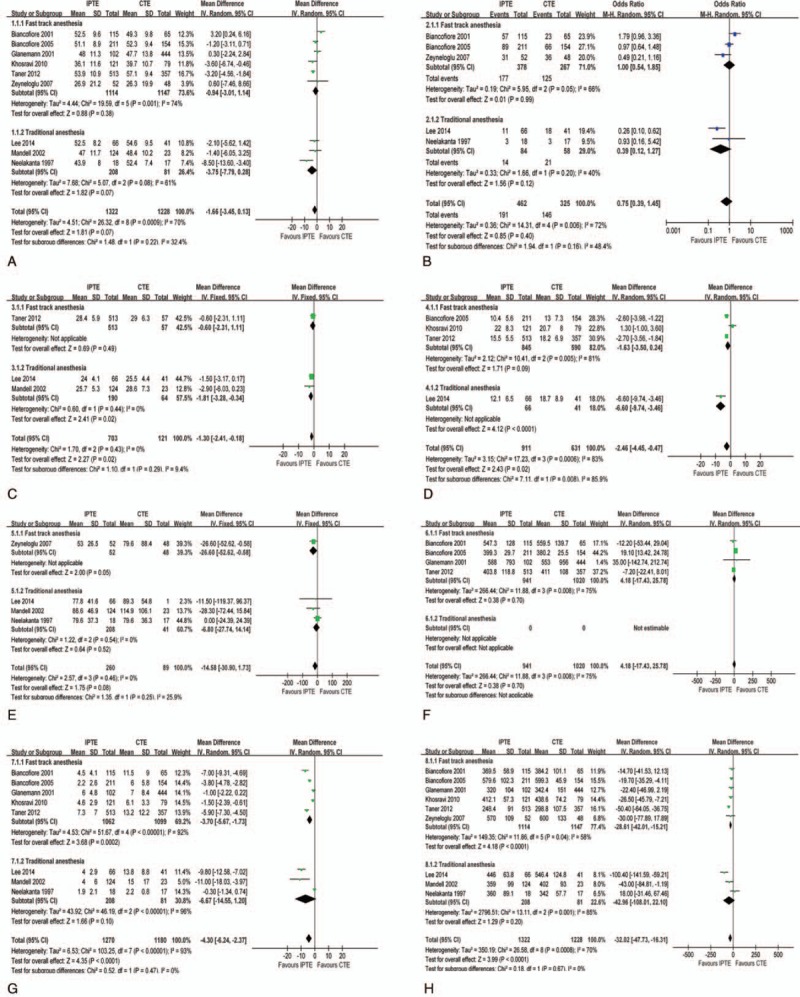
Figure 2.

Baseline features comparison for IPTE and CTE after LT. (A). Recipient age; (B). Recipient BMI; (C). Child C status %; (D). MELD score; (E). Preoperative creatinine; (F) Cold ischemic time of graft; (G) amount of PCR transfused (H) Duration of surgery.
