
Figure 3.
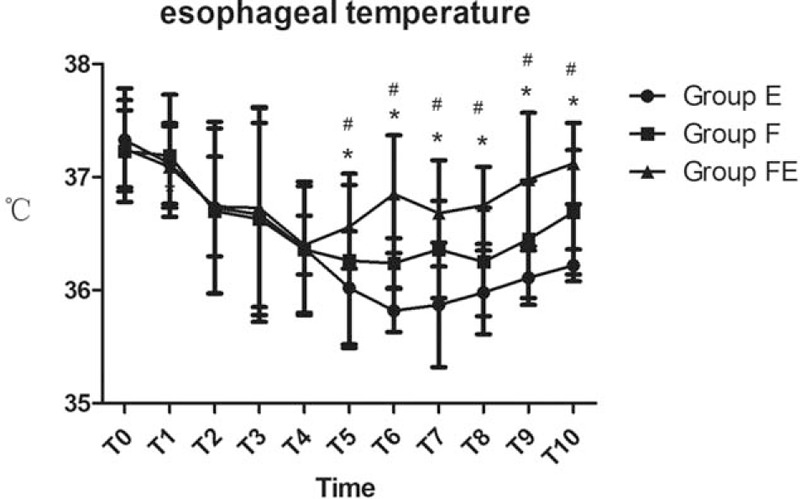
Esophageal temperature data for the 3 groups of patients at various timepoints: arrival in the operating room (T0), just before anesthesia induction (T1), at the beginning of the operation (T2), 10 minutes (T3), 20 minutes (T4), 30 minutes (T5), 60 minutes after the onset of operation (T6), at the end of operation (T7), and 10 minutes (T8), 20 minutes (T9), and 30 minutes (T10) after arriving in the PACU. ∗P <.05 versus Group E, #P <.05 versus Group F.