
Figure 2.
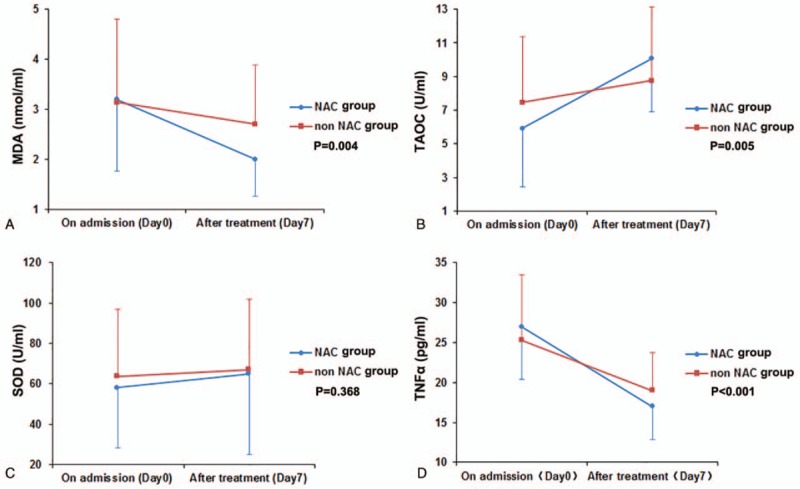
Comparison of oxidative stress and inflammation in the NAC and non-NAC groups before and after treatment. A: Comparison of malondialdehyde (MDA) in the NAC and non-NAC groups. B: Comparison of total antioxidant capacity (TAOC) in the NAC and non-NAC groups. C: Comparison of superoxide dismutase (SOD) in the NAC and non-NAC groups. D: Comparison of tumor necrosis factor alpha (TNF-α) in the NAC and non-NAC groups. NAC = N-acetylcysteine.