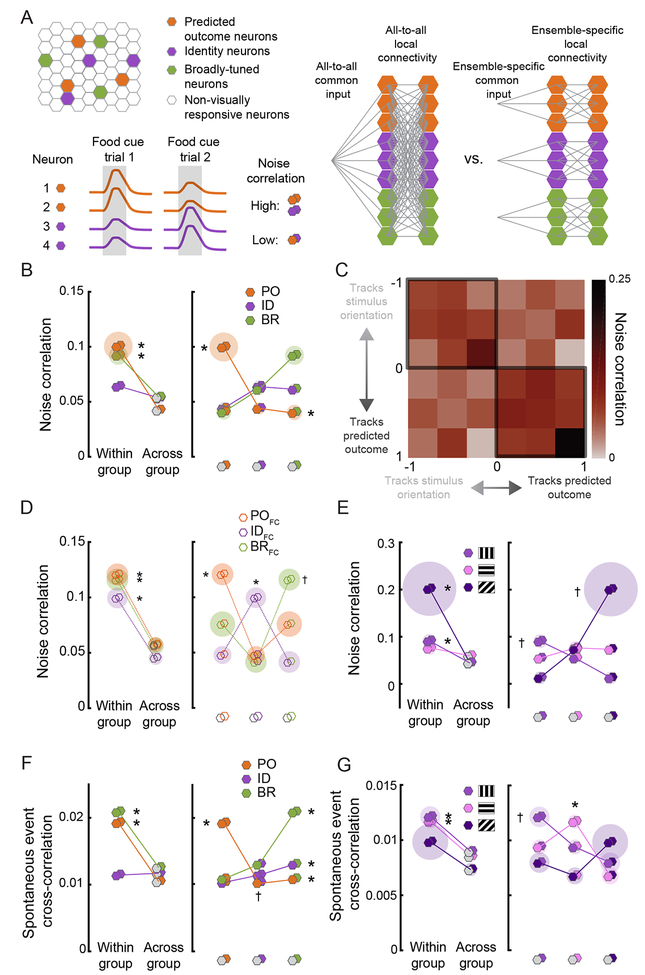
Figure 5. Correlated ensembles of PO, ID, and BR neurons.
A. Top left: schematic of PO, ID, and BR neurons within a field of view. Right: hypothetical profiles of local and long-range connectivity, were the network of PO, ID, and BR neurons to show either full connectivity or selective connectivity within functionally-distinct ensembles. Bottom left: hypothetical pairwise food cue response co-fluctuation (noise correlation) in simultaneously recorded PO and ID neurons (bottom; gray shaded area: cue presentation). Even though the mean response of all neurons is identical, PO neurons (1 & 2) have larger responses on trial 1, and ID neurons (3 & 4) have larger responses on trial 2, resulting in higher cue-evoked noise correlations within- vs. across-group. For the pairwise correlation analyses below, hexagon pairs denote the functional identity of each neuron in the pair.
B. PO and BR neurons showed higher noise correlations within-group vs. across-group. Left: pairwise correlations between two neurons in the same group (same color) vs. in any other group (gray). Right: all pairwise comparisons. Shaded discs indicate s.e.m. * p < 0.01, Wilcoxon Rank-Sum (left) and Kruskal-Wallis (right).
C. Noise correlation heatmap for all neurons, ranging from those that mostly tracked the orientation of a stimulus to those that mostly tracked the predicted outcome. Pairs of neurons with similar tracking properties had higher pairwise noise correlations.
D. Same analyses as in B, but restricted to the subsets of PO, ID, and BR neurons that preferred the food cue (FC). Right: Pairwise noise correlations were higher within-group (same color) vs. across-group (different colors). * significantly higher mean correlation for neurons in the same vs. in different groups (gray): p < 0.01, Wilcoxon Rank-Sum (left) and Kruskal-Wallis (right), Bonferroni corrected. † significantly higher mean correlation of BRFC neurons with other BRFC neurons than with IDFC neurons: p < 0.001, Kruskal-Wallis, Bonferroni corrected. All other p values > 0.05. Shaded disc radius: s.e.m.
E. Subgroups of ID neurons preferentially responsive to a specific stimulus orientation showed higher noise correlations within- vs. across-subgroup. Left: within-subgroup vs. across-subgroup comparisons. Right: all pairwise comparisons. * p < 0.01, within- vs. across-subgroup. † p < 0.01, highest vs. lowest pairs; Kruskal-Wallis/Wilcoxon Rank-Sum, Bonferroni corrected
F. PO and BR neurons showed higher spontaneous event ross-correlations within-group vs. across-group. * denotes p < 0.001 for within- vs. across-group comparison or vs. all other groups; Kruskal-Wallis/Wilcoxon Rank-Sum, Bonferroni corrected. † p < 0.05, POID vs. BR-ID pairs.
G. Subgroups of ID neurons showed higher spontaneous event cross-correlations within-subgroup vs. across-subgroup. * p < 0.01, within- vs. across-subgroups. † p < 0.01, highest vs. lowest pairs:, Kruskal-Wallis/Wilcoxon Rank-Sum, Bonferroni corrected. See also Figures S5-S6.

